
Extended Data Fig. 3 |. Changes in the size of the mate pool over time.
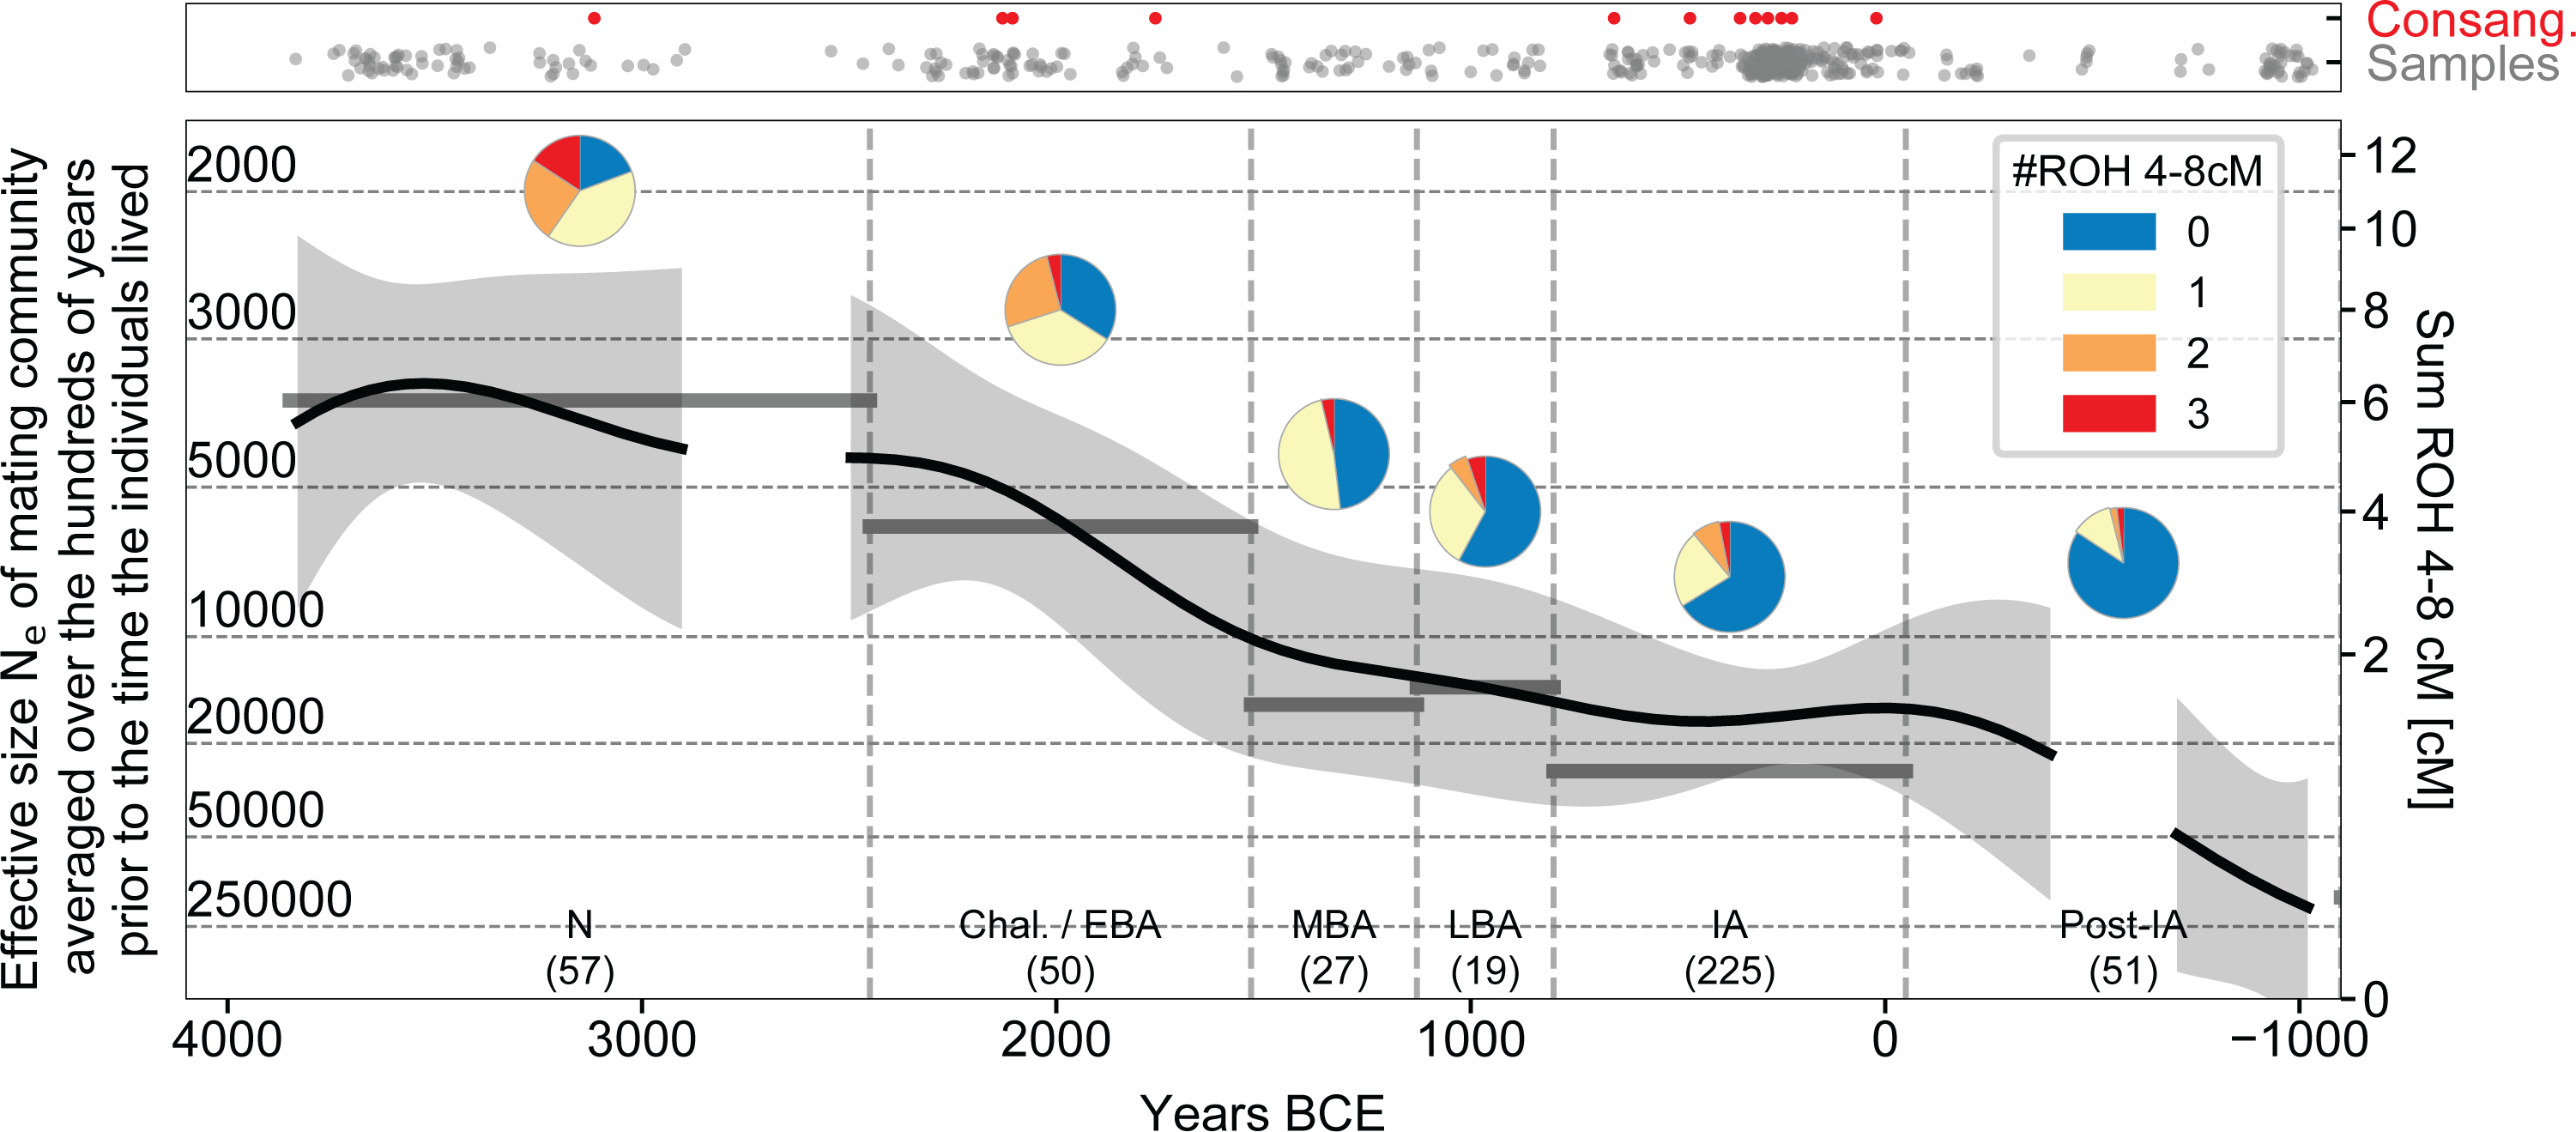
Close kin unions were rare at all periods as reflected in the paucity of individuals harbouring >50 centimorgans (cM) of their genome in runs of homozygosity (ROH) of >12 cM (red dots in top panel). The number of ROH of size 4–8 cM per individual (bottom panel) reflects the rate at which distant relatives have children, providing information about the sizes of mate pools (Ne) averaged over the hundreds of years prior to when individuals lived; thus, the broad trend of an approximately four-fold drop in Ne from the Neolithic to the IA is robust, but we may miss fluctuations on a time scale of centuries. The thick black lines represent the mean Ne obtained by fitting a mathematical model of Gaussian process with a 600-year smoothing kernel (gray area 95% confidence interval). The horizontal grey lines show period averages from maximum likelihood which can differ from the mean obtained through the mathematical modeling if the counts do not confirm well to a Gaussian process. We interrupt the fitted line for periods with too little data for accurate inference (<10 individuals in a 400-year interval centered on the point).