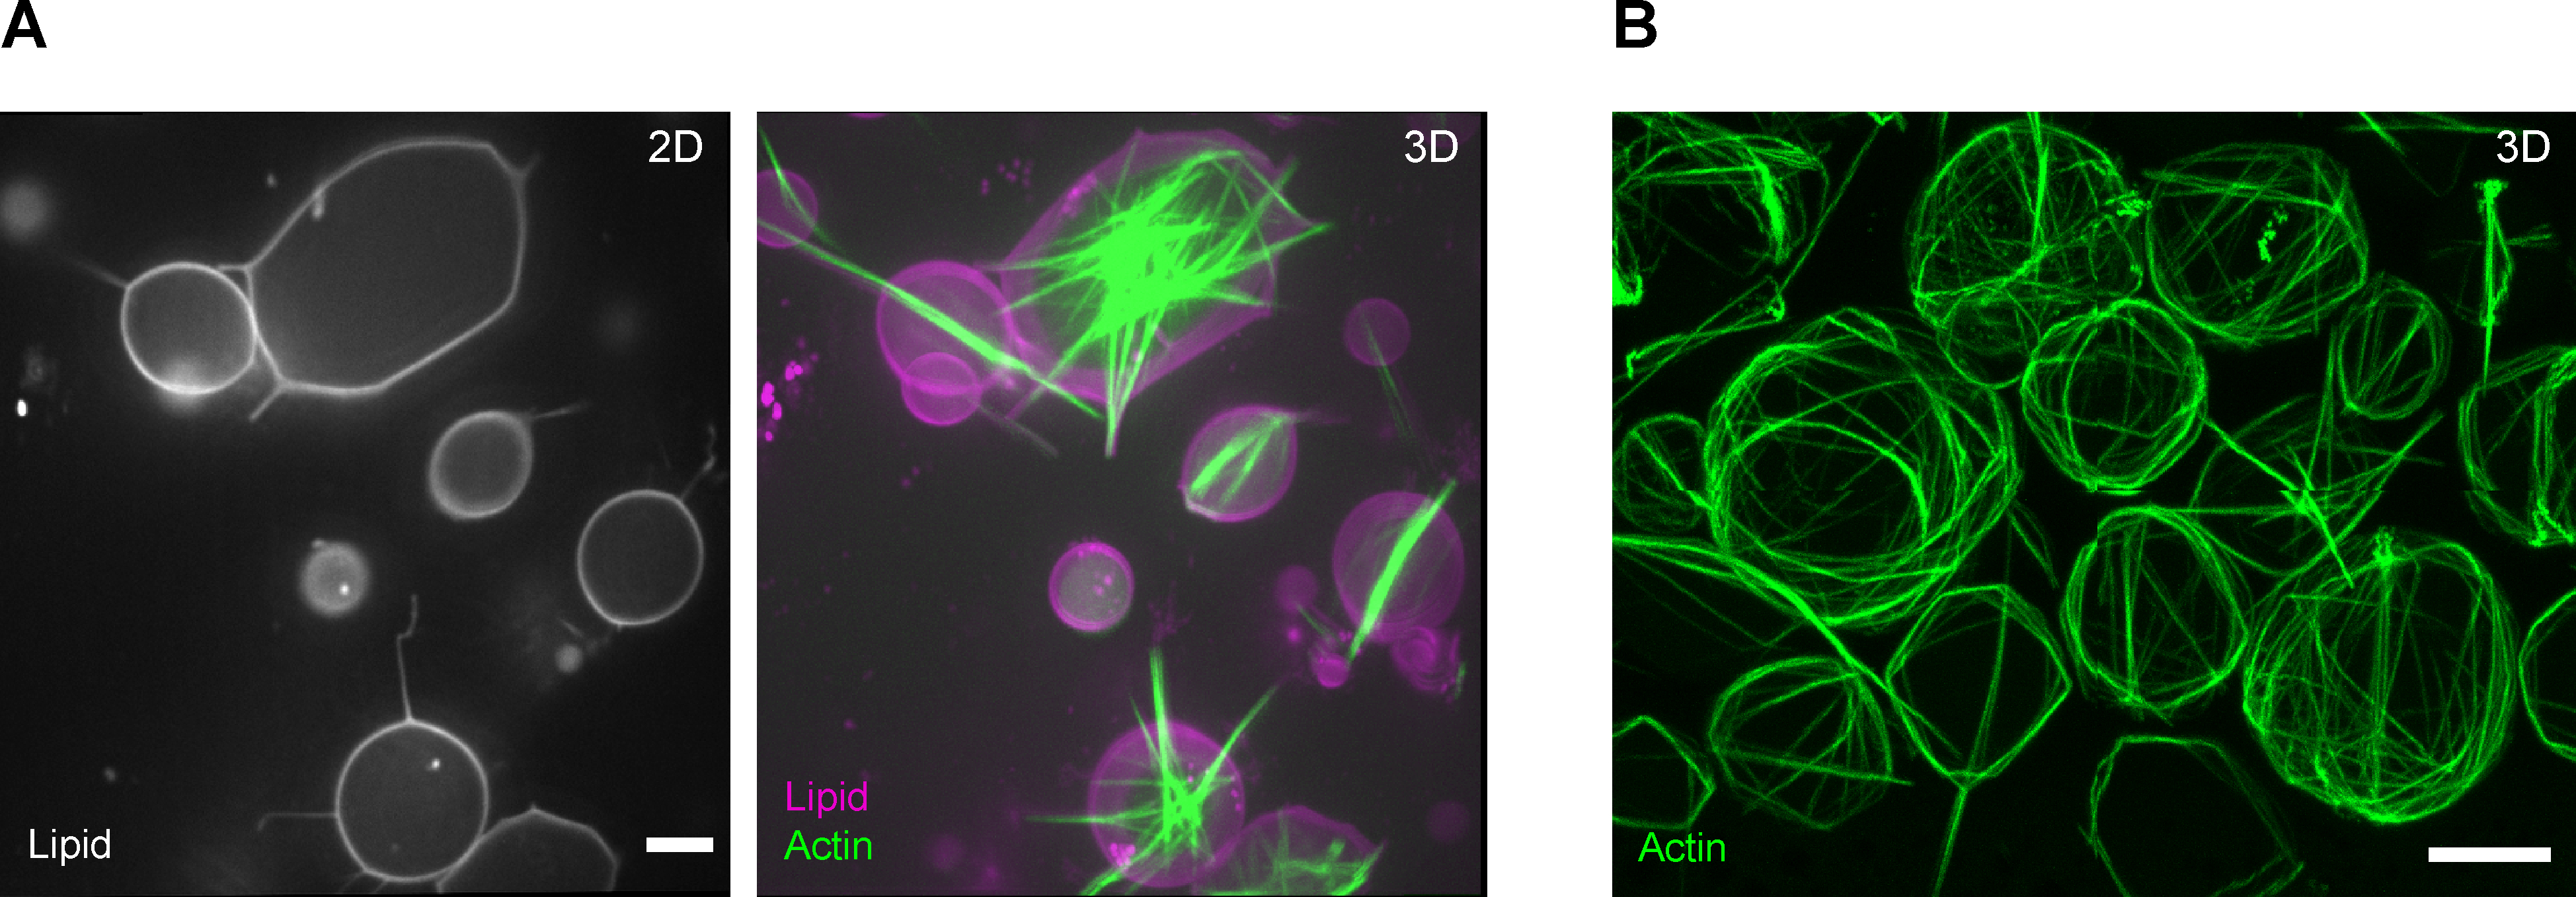
Figure 2: Encapsulation of actin bundle structures.

(A) The images show representative fluorescence confocal slices of GUVs (left) and maximum projections of a confocal z-stack of actin and lipid channels (right). Fascin, 2.5 μM; actin, 5 μM (including 10% ATTO 488 actin). Scale bar = 10 μm. (B) Encapsulation of actin bundle structures using conventional cDICE. The image shows a representative maximum projection of confocal fluorescence images of encapsulated actin bundles formed in the presence of fascin. Fascin, 0.9 μM; Actin, 6 μM. Scale bar = 10 μm.
