Figure 11 .

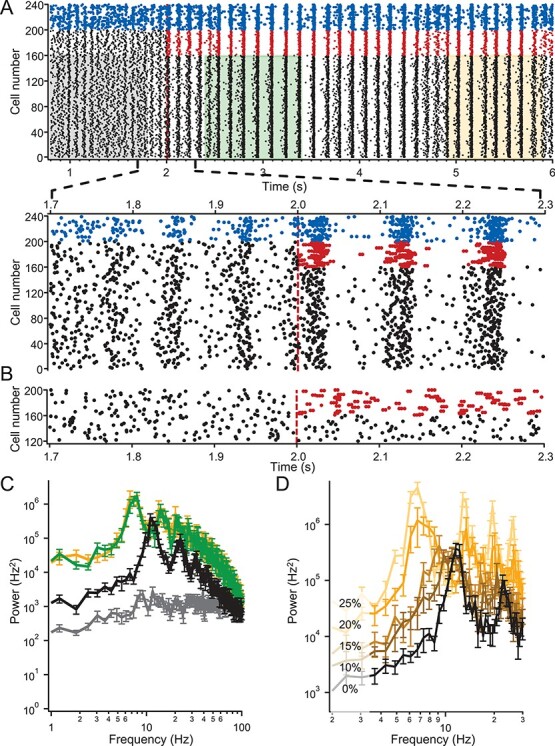
Effect of Kv2 block on rhythmicity in a subset of neurons in a simplified model of a local cortical circuit (full details in Materials and Methods and text). (A) Top: Raster plot of firing of 200 excitatory neurons (E; black, with Kv2 or red without Kv2) and 40 inhibitory (I, blue) neurons in a randomly connected circuit (10% chance of synaptic connection). Each neuron was driven by a random seed of exponentially filtered noise (i.e., uncorrelated noise to each neuron with tau = 5 ms and standard deviation = 350 pA) with a 350 pA DC offset for E neurons or a 125 pA DC offset for I neurons. Note that Kv2 is turned off after 2 s (red dashed line) of firing in 40 E neurons (color change from black to red). Shaded areas indicate 1-s epochs of firing where the power density plots of corresponding color in C were calculated. Bottom: The raster is shown at an expanded time base around the time when Kv2 is turned off. (B) Same as A except the neurons are not connected. (C) Plots of the average power spectral density of firing for E neurons 1 through 160 (i.e., neurons in which Kv2 is always on) for runs from 10 different 10% randomly connected circuits for a 1-s time period prior to tuning Kv2 off in a different set of E neurons in the circuit (black), 400 ms after turning off Kv2 (green) and 2.9 s after turning off Kv2 (orange). Gray trace is for the same set of neurons but from 10 runs of unconnected circuits. (D) Plots of the power spectral density of firing for E neurons 1 through 150 (i.e., Kv2 always on) after Kv2 is tuned off in 10% (dark brown), 15% (light brown), 20% (orange), or 25% (yellow) of the 200 E neurons (2.9 s after Kv2 turned off; avg. from 10 different circuit runs with 10% connectivity). Black PSD plot is from same set of 150 E neurons prior to turn off of Kv2.
