Figure 3 .

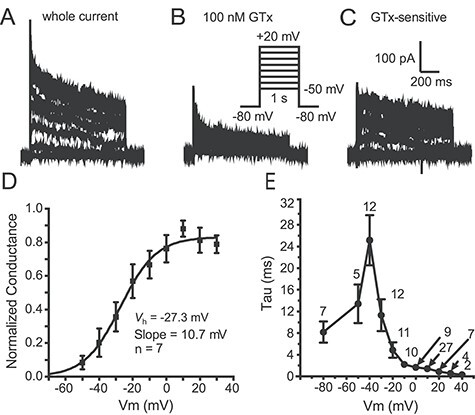
Characteristics of Kv2 current in Thy1 neurons. (A) Example traces from a somatic outside-out macropatch in control solution (voltage protocol in inset in B). (B) Traces from the same macropatch during application of 100 nM GTx. (C) The GTx-sensitive current was obtained by subtraction. It activated relatively rapidly and inactivated slowly. (D) Summary activation voltage-dependence data for seven macropatches (mean ± SEM). The half-activation voltage (V0.5) and slope are indicated on the graph. (E) Summary data for time constant (Tau) for activation and deactivation as a function of voltage (Data include 7 macropatches where we stepped to all voltages, as in D. At +10 mV, we had an additional 20 patches so n = 27). We fit the rising phase of the GTx-sensitive traces to obtain the time constants from above −50 mV, and we fit to the tail currents from the +10 mV step to voltages below −30 mV.
