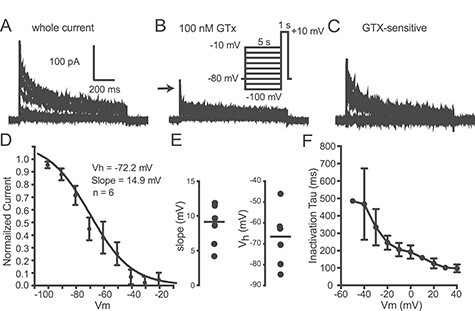
Figure 4 .

Steady-state inactivation. (A) Representative current traces from an outside-out macropatch in control solution in response to voltage protocol shown as inset in B. (B) Traces from the same macropatch in the presence of 100 nM GTx. Inset: voltage protocol for A–C. (C) GTx-sensitive currents for same macropatch as A and B. (D) Plot of peak current normalized to maximum current. The mean data from six cells were well fit by a single Boltzmann function with the half-inactivation voltage (Vh) of −72 mV and slope of 14.9 mV. (E) Scatter plots (mean indicated by horizontal line) showing the slope and half-inactivation voltage (Vh) for the same six cells. (F) Summary data for the same six cells for the inactivation time constant, (t) as a function of voltage (taken from the activation protocol in Fig. 3). Data were fit by a single exponential.
