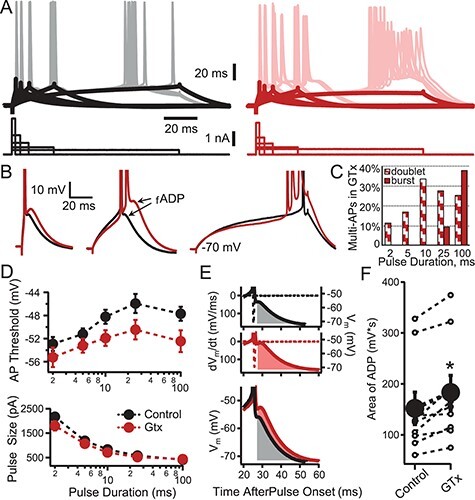
Figure 5 .

Effect of GTx on action potential threshold and the fADP. (A) Representative somatic whole-cell current-clamp recording of a Thy1 PN in control (black, left) and in the presence of GTx 100 nM (red, right). Superimposed sweeps are shown of voltage responses (upper) evoked by current steps (lower) of varying duration (2, 5, 10, 25, and 100 ms). The amplitudes of the current steps were adjusted to elicit action potentials 50% of the time. The thick black and red lines denote the average voltage trajectory of nonspiking trials, which were used to facilitate measurement of spike threshold in traces when an AP was elicited. (B) Examples of suprathreshold voltage responses from 2, 25, and 100 ms current steps in control (black) and GTx (red). Note that GTx increases the size of the fADP and, in some cases, results in bursts of three or more APs. (C) Histogram showing the percent of cells that were converted in GTx to onset doublet or burst firing at each duration of current pulse. (D) The mean ± SEM for AP threshold (top) and current amplitude (bottom) is plotted as a function of the current step duration in control and GTx (black and red, respectively), n = 9. GTx caused a small decrease in AP threshold for all durations of current (significant for the 10- and 25-ms steps, P < 0.05, two-tailed Student’s t-test). (E) Example of the method used for quantification of the effect of GTx on fADP size during 25-ms current steps for control and GTx conditions. Only trials with a single AP during the 25-ms current step were used. The membrane voltage (solid lines) and dV/dt (dotted lines) are plotted versus time after current-step onset. The fADP size was calculated as the integral (shaded areas) of the postspike voltage after crossing dV/dt = 0 until the return of the baseline membrane voltage (−70 mV). The bottom panel shows the control and GTx conditions superimposed. (F) Comparison of fADP size (integrals of area after the AP as in D) in control and GTx (individual cells = open circles; mean ± SEM = closed circles, n = 9 cells; P < 0.0025 Student’s paired t-test).
