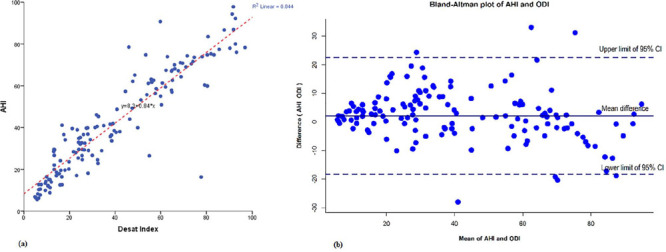
Figure 1.

A. Scatter plot showing apnea hypopnea index (AHI) versus oxygen desaturation index (ODI) with linear regression and 95% confdence interval. R2 linear 0.844, AHI=0.84 x ODI + 8.3; B. Bland-Altman plot of apnea hypopnea index (AHI) and oxygen desaturation index (ODI) where, X axis represents the average of AHI and ODI and the Y axis represents the difference of AHI and ODI (AHI-ODI). When the average of AHI and ODI is very low or high, the ODI tended to overestimate AHI.
