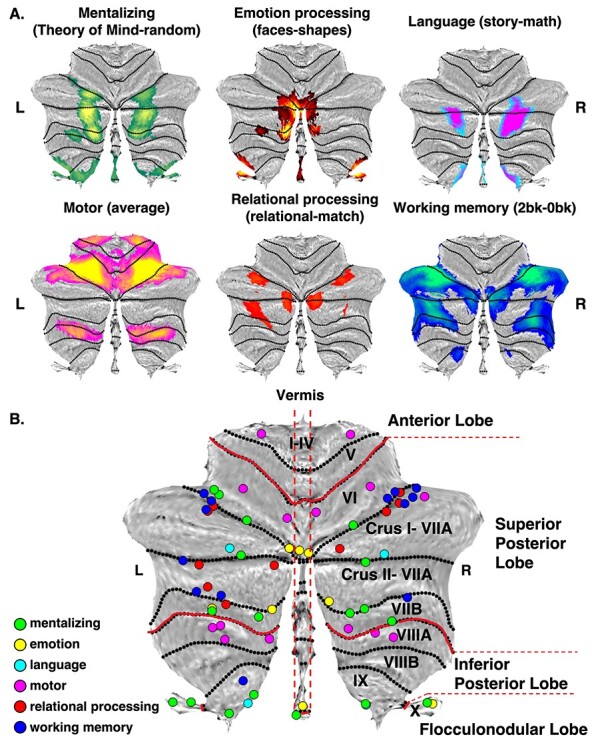
Figure 1 .

Group activation maps for fMRI tasks, and local maxima. (A) Group-level activation maps for the 6 fMRI tasks (mentalizing, emotion, language, motor, relational processing, and working memory). Activation colors indicate the particular task. L = left; R = right. (B) Local maxima for each functional task. Each group of colored circles corresponds to a functional task. Numbers in parentheses (e.g., L:x; R:z) indicate hemisphere and the number of local maxima. Green = mentalizing (L:11; R:7); Yellow = emotion processing (L:5; R:4); turquoise = language processing (L:2; R:2); Magenta = motor (L:7; R:7); red = relational processing (L:6; R:4); blue = working memory (L:7; R:6). The total number of local maxima was 68 (L:38; R:30). Cerebellar flatmaps and local maxima were created using the SUIT toolbox (Diedrichsen and Zotow 2015).
