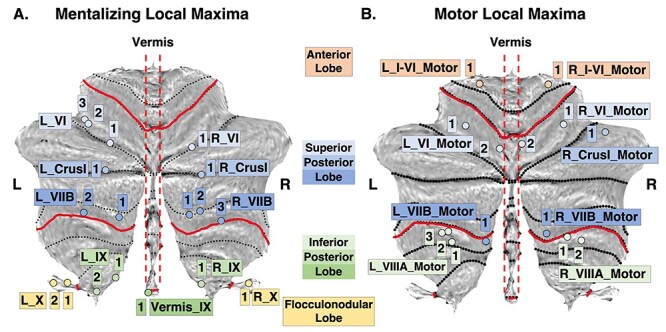
Figure 2 .

Mentalizing and motor cerebellar local maxima. (A) Mentalizing local maxima. (B) Motor local maxima. The red lines indicate cerebellar lobes, and the black dashed lines indicate cerebellar lobules. Each local maximum is named using this key: Cerebellar hemisphere_cerebellar lobule_number (e.g., local maximum L_VI_2 is on the left cerebellar hemisphere, lobule VI, and is the second one in that lobule). Motor local maxima follow the same naming convention with an extra “Motor” at the end. The color of each local maximum further indicates the cerebellar lobe in which it belongs (blue = superior posterior lobe; green = inferior posterior lobe; yellow = flocculonodular lobe). L = left; R = right. Cerebellar flatmaps and local maxima were created using the SUIT toolbox (Diedrichsen and Zotow 2015).
