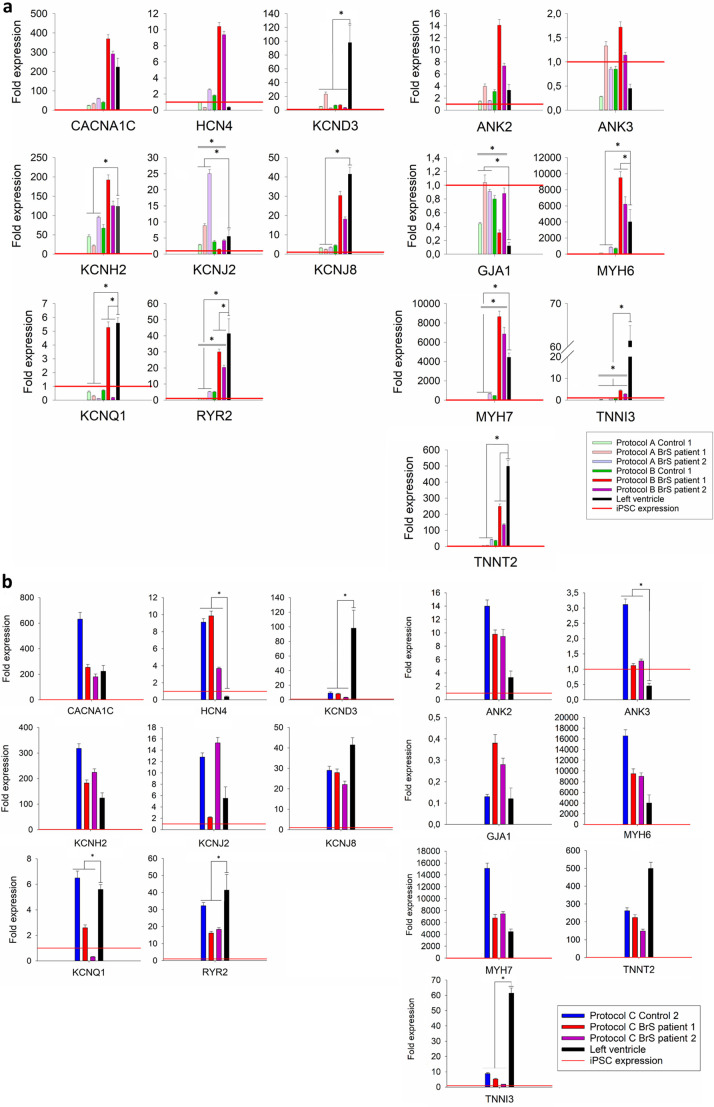
Fig. 3.
Transcript levels of selected cardiac ion channel and structural genes in generated iPSC-CMs as fold expression compared to iPSCs. (A) Relative expression levels of tested cardiac markers for cells differentiated with protocols A and B: in light green Control 1, in light red BrS patient 1, in light purple BrS patient 2; protocol B: in green Control 1, in red BrS patient 1, in purple BrS patient 2. (B) Relative expression levels of tested cardiac markers for: Control 2 presented in blue, BrS patient 1 in red and BrS patient 2 in purple, obtained in validation experiment of protocol B. The graphs show the average ±s.d. values from triplicates obtained from the tested samples. In each panel, measured expression levels of the analyzed cardiac markers in left ventricle tissue of a healthy donor (in black) are indicated next to the expression measured in the analyzed iPSC-CM samples. Relative transcript expression level in iPSC is indicated with red horizontal line for each of the tested markers (fold expression=1). Statistically significant differences in relative transcript expression between the tested protocols and in relation to LV tissue are indicated (respectively) with a double or a single line and a * above the graphs. Calculated P-values for each tested marker between two groups (protocol A versus protocol B) and in relation to the LV tissue are listed in Table S3.

