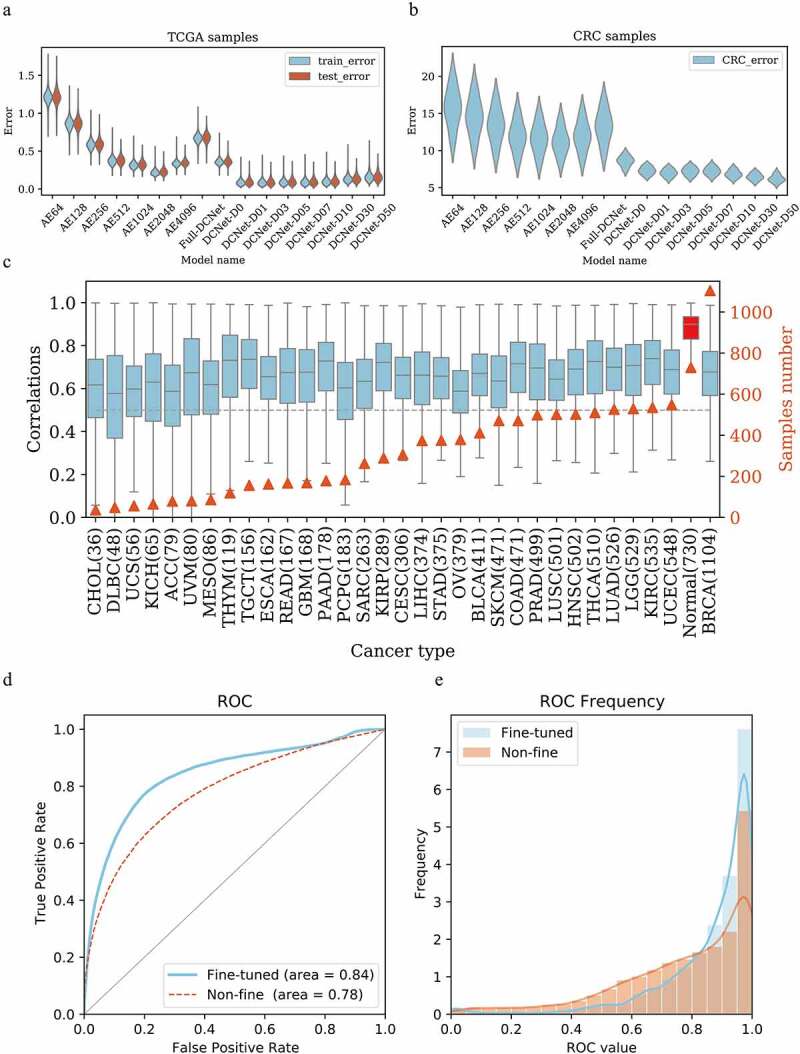
Figure 2.

DCNet model determination and performance evaluation. (a) The root mean square error distribution of different models in the training set and test set in the TCGA sample. y is the root mean square error, and x is different neural network models. AE64~ AE4096 are three-layer autoencoders with 64 ~ 4096 neurons in each layer. Full-DCNet is similar to the DCNet architecture, but there is a fully connected neural network between neurons. DCNet-D0 means that the input data is not randomly censored, and DCNet-D01, DCNet-D03, DCNet-D05,DCNet-D07, DCNet-D10, DCNet-D30, and DCNet-D50 means that the input data is randomly censored by 1%, 3%, 5%, 7%, 10%, 30%, and 50%, respectively. Blue is the training set and red is the test set. (b) The root mean square error distribution of different models in the CRC sample. y is the root mean square error, and x is different neural network models, same as Figure A. (c) For samples of different cancer types, the DCNet predicted value is correlated with the true value. The left ordinate is the correlation distribution value, the right ordinate is the number of samples, the abscissa is the cancer type, and the gray dashed line is the correlation 0.5. (d) Draw the ROC curve of the marker gene in single-cell levels, the red is the network without fine-tuning, the blue is the network after the fine-tuning, the abscissa is the false positive rate, and the ordinate is the true positive rate. (e) Frequency distribution diagram of ROC value calculated by gene. The abscissa is the ROC value, and the ordinate is the frequency distribution of the corresponding ROC value.
