
Figure 5.
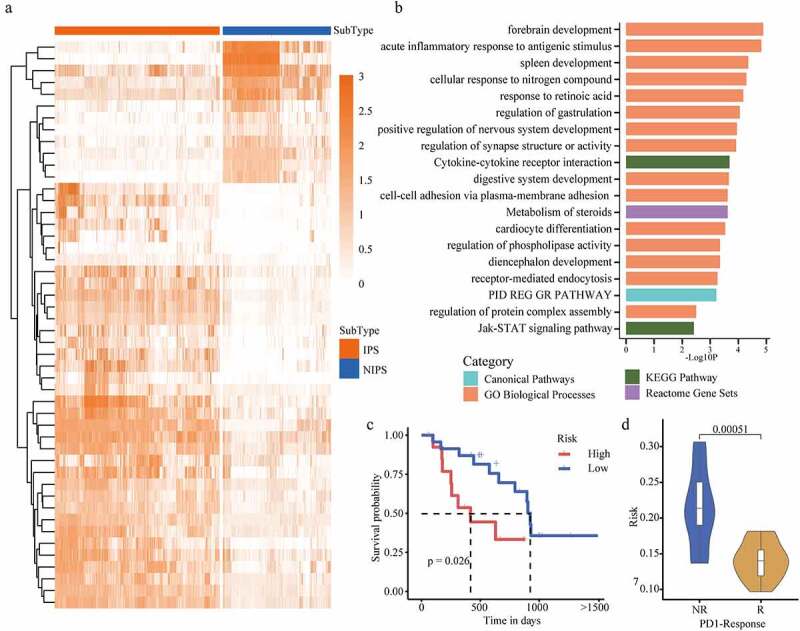
PD1 response samples verify cancer subtypes. (a) A heatmap of the expression level of differential genes. The darker the color, the higher the expression level of the gene. The upper band represents the type of cancer pressure type, red is IPS, and blue is NIPS. (b) Gene function enrichment, the abscissa is -Log10P level, and the ordinate is the function name. Blue is Canonical pathway, green is KEGG pathway, Orange is GO biological process, and purple is response group gene combination. (c) Survival curves of PD1 response and non-response samples. (d) The risk of PD1 response and non-response samples are compared. NR is the non-response group, R is the response group, and the ordinate is the risk score.