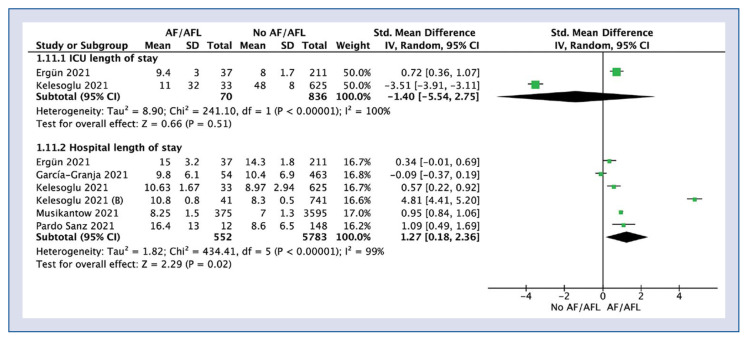
Figure 4.
Forest plot of length of hospital stay in atrial fibrillation/atrial flutter (AF/AFL) and no-AF/AFL groups. The center of each square represents the weighted standard mean differences for individual trials, and the corresponding horizontal line stands for a 95% confidence interval (CI). The diamonds represent pooled results; ICU — intensive care unit.

