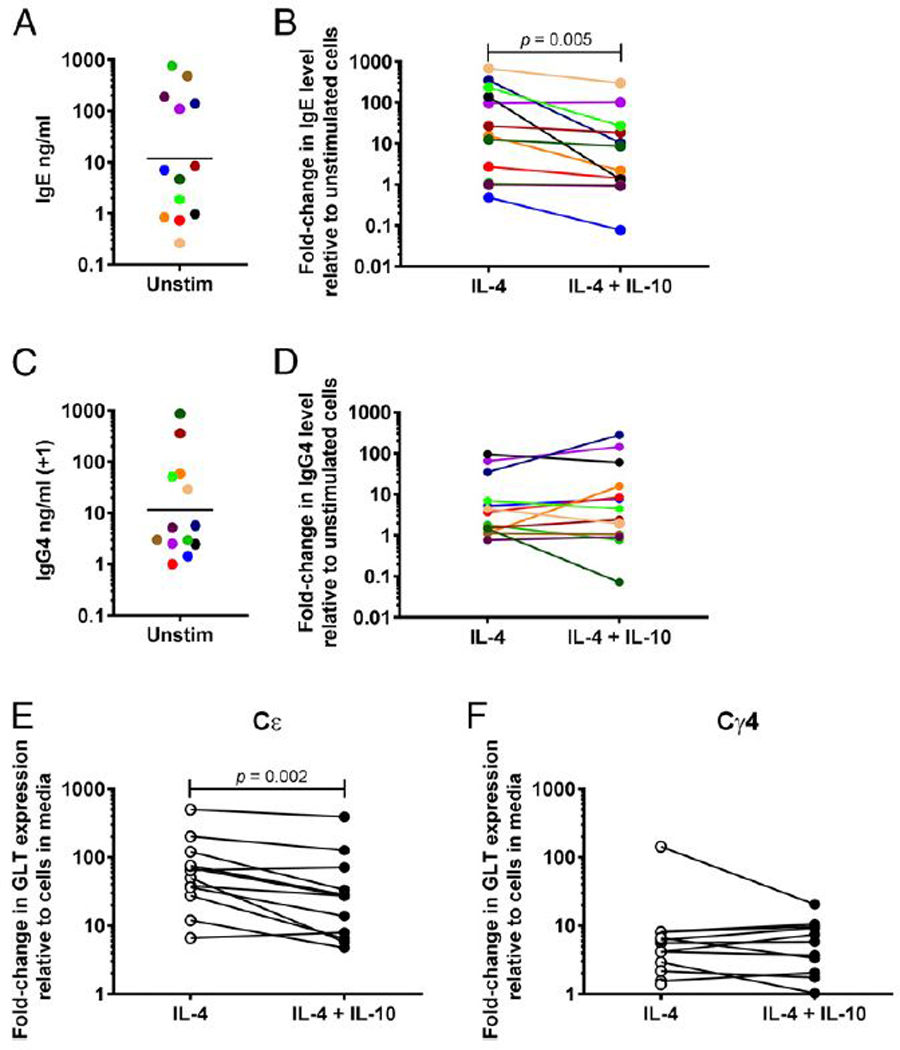
FIGURE 4. IL-10 decreases IL-4-induced expression and production of IgE in PBMC cultures.

(A and C) Spontaneous production of IgE (A) and IgG4 (C) by PBMCs. (B and D) Fold change in levels of IgE (B) and IgG4 (D) in culture supernatants of PBMCs stimulated with IL-4 with and without IL-10 relative to PBMCs cultured in media alone (n = 13). Each individual is represented with a unique color; colors are consistent for figures (A)–(D). (E and F) Fold change in expression of Cε (E) and Cγ4 (F) GLTs in PBMCs stimulated with IL-4 with (closed circles) and without (open circles) IL-10 relative to PBMCs cultured in media alone (n = 12). The p values were determined using Wilcoxon matched pairs signed-rank test. Unstim, unstimulated.
