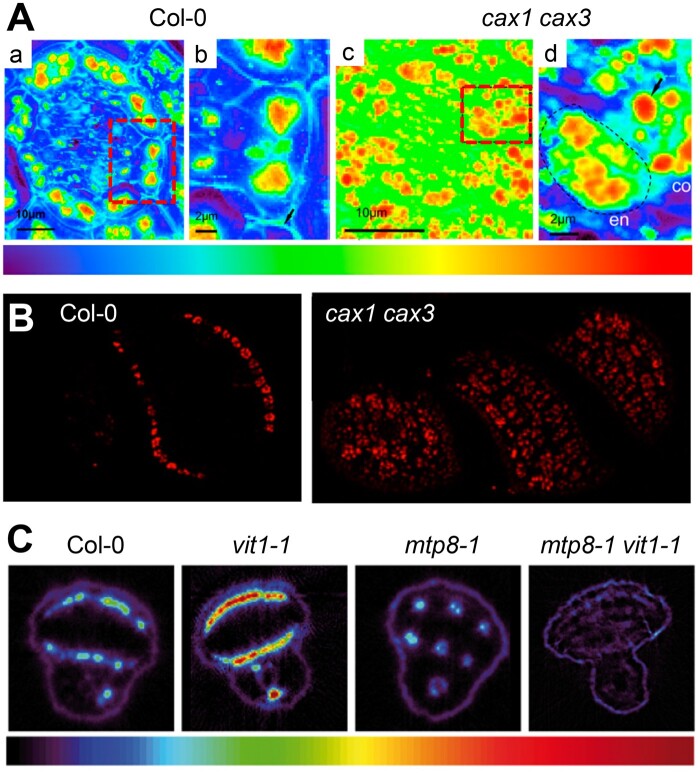
Figure 3.
Synchrotron µXRF analyses visualize the allocation of Ca2+ and Mn2+ in Arabidopsis seeds by vacuolar transporters. A, High-resolution SXRF maps of Ca2+ distribution in endodermal layers of the hypocotyl (a and c) and single endodermal cells (b and d; positions indicated by rectangles in a and c, respectively) in seeds from Col-0 and cax1cax3 plants. Colors indicate normalized fluorescence (logarithmic scale). Figure taken from Punshon et al. (2012), modified. B, High-resolution SXRF maps of Mn distribution in whole seeds of Col-0 and cax1cax3 plants. Figure taken from Punshon et al. (2012), modified. C, Distribution of Mn in intact seeds from Col-0, vit1-1, mtp8-1, and mtp8-1vit1-1 plants determined by µSXRF tomography. The color scale ranges from 0 to 1,100 µg g−1 Mn. Figure taken from Eroglu et al. (2017), modified.

