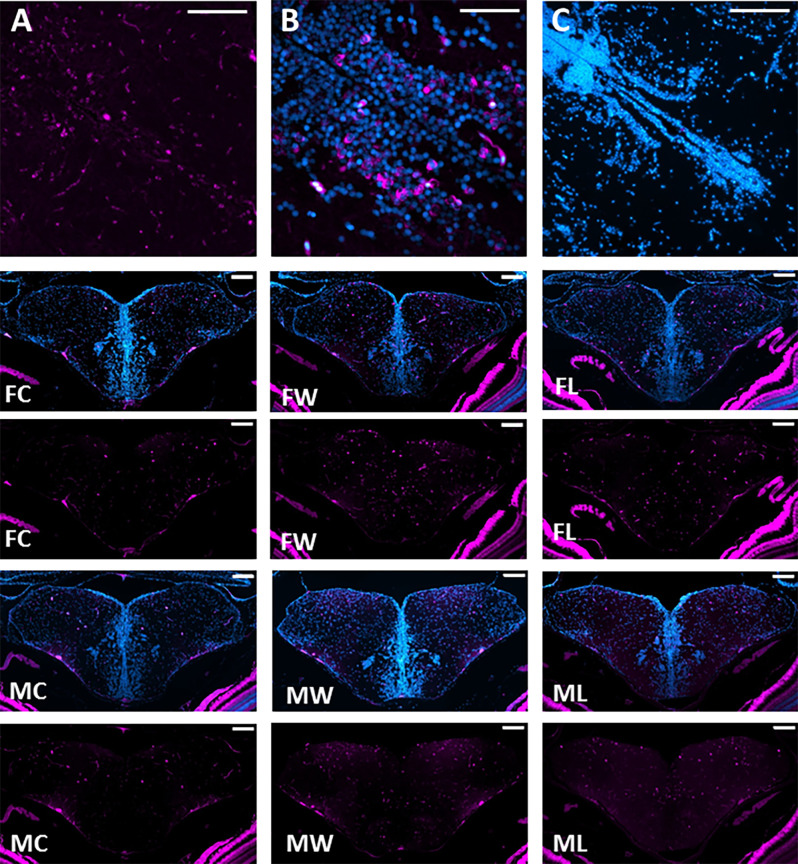
Figure 2.
Neuronal activation throughout the brain Social Decision Making Network. (A) pS6 immunopositive staining with cytoplasmatic location is indicated in magenta. (B) Sections were co-stained with DAPI, indicated in cyan. (C) Negative control for pS6 and DAPI immunofluorescence. Representative photomicrographs of double DAPI (blue) and pS6 (magenta) and only pS6 staining (magenta) in Dm, Dl, Vc, Vd, and Vv of female controls (FC), female winners (FW), female losers (FL), male controls (MC), male winners (MW), and male losers (ML). Scale bars represent 100 mm.

