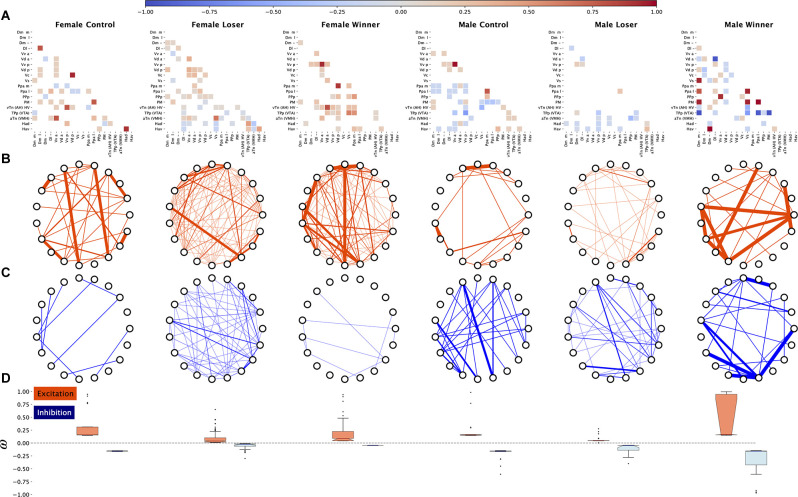
Figure 4.
Functional connectivity across the brain regions induced by aggressive interactions, inferred from pS6 immunoreactive cells used as a marker of neural activity. (A) Adjacency matrices for each treatment showing the strongest negative and positive edges, sparsified for visualization puroposes, (B) excitation (positive weights) subnetworks for each treatment, (C) inhibition (negative weights) subnetworks for each treatment, (D) distributions of edge weights for excitation and inhibition subnetworks for each treatment.

