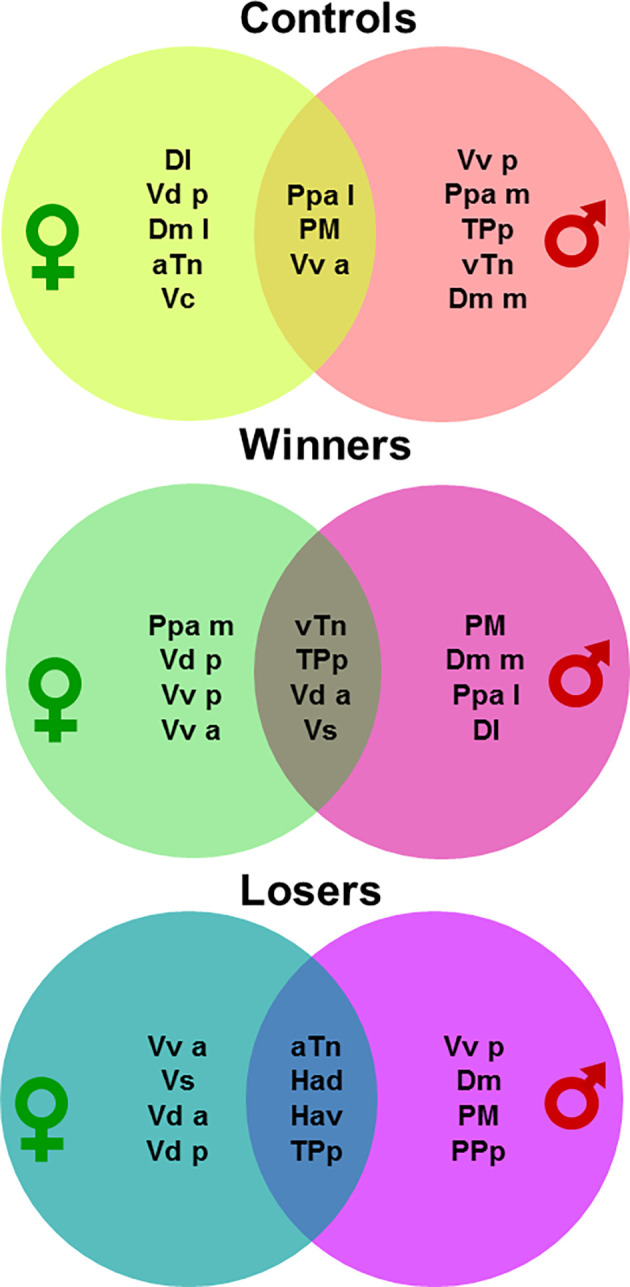
Figure 5.

Venn diagrams representing the most central nodes of the brain social decision-making network in males and females for each social treatment (i.e., non-interacting control, winners, losers). For brain region abbreviations please see the “Materials and Methods” section.
