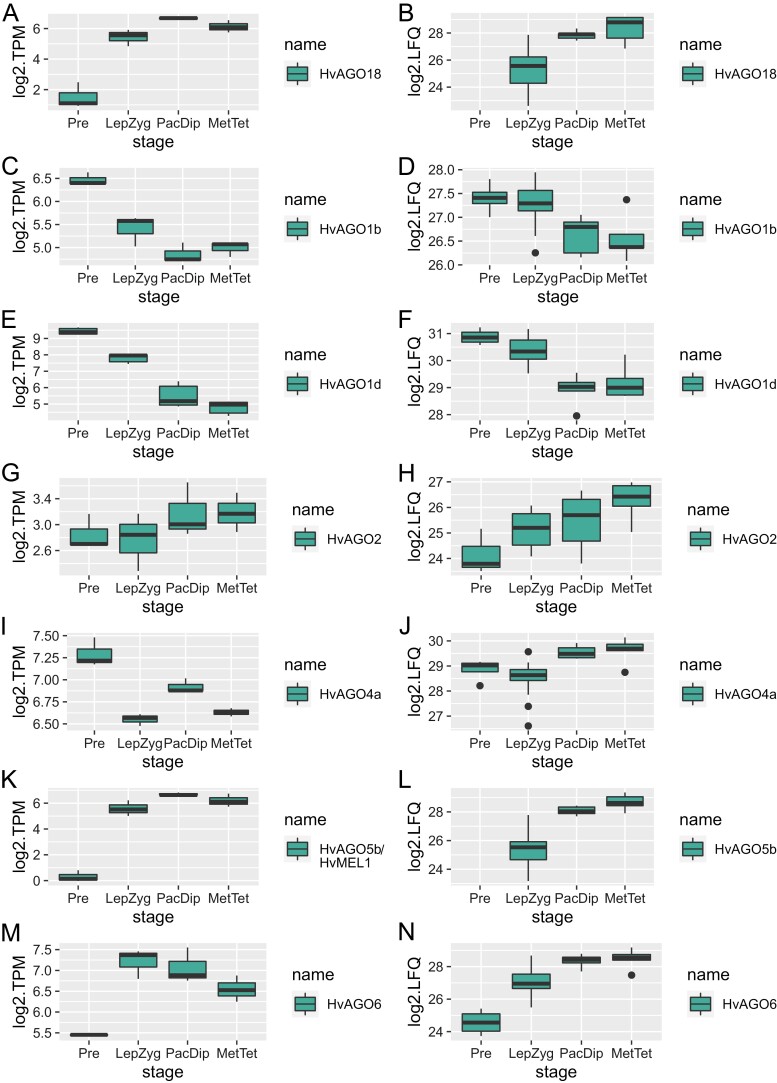
Fig. 5.
Comparison of the pattern of AGO gene expression in the barley anther transcriptome (BAnTr) (Barakate et al., 2021) with BaAP AGO protein abundance. For box plots, BaAP anther lengths were binned according to their meiotic stage relative to the BAnTr dataset: 0.6mm, pre-meiotic; 0.7–0.9mm, leptotene–zygotene; 1.0mm, pachytene–diplotene; and 1.1mm, metaphase I. Individual points represent outliers.

