FIGURE 3.
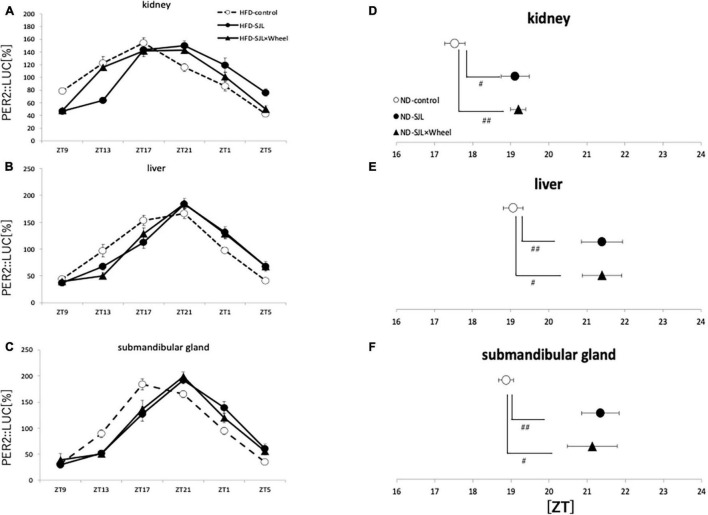
Wave form and acrophase of PER2:LUC expression rhythm in each organ in LD or SJL conditions during ND feeding. (A–C) Waveforms for each group in kidney, liver, and submandibular gland. The group raised under normal LD conditions was designated as the control. (D–F) Acrophase for each group in kidney, liver, and submandibular gland. Data are presented as mean ± standard error of the mean (ND-control, n = 6; ND-SJL, n = 7; ND-SJL × Wheel, n = 6). #p < 0.05, ##p < 0.01 (Kruskal-Wallis test with Dunn’s multiple comparisons test).

