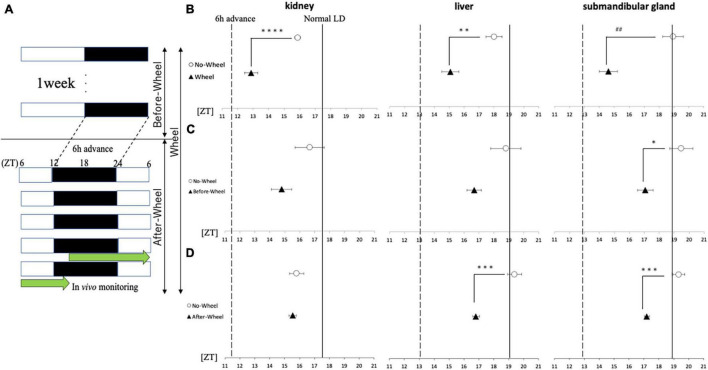
FIGURE 6.
Acrophase of PER2:LUC expression rhythm in each organ in response to 6 h of advance light conditions. (A) Protocols of three trials with different light conditions and wheel-running timings. (B–D) Comparison of the peak time of PER2:LUC expression (acrophase) in each trial. The solid line shows the acrophase under normal LD conditions with no wheel-running, and the wavy line shows the value advanced from that point by 6 h, or the acrophase that should be aimed for. Data are presented as mean ± standard error of the mean (n = 6 for each group for all trials). *p < 0.05, **p < 0.01, ***p < 0.001, ****p < 0.0001 (t-test); ##p < 0.01 (Mann-Whitney test).

