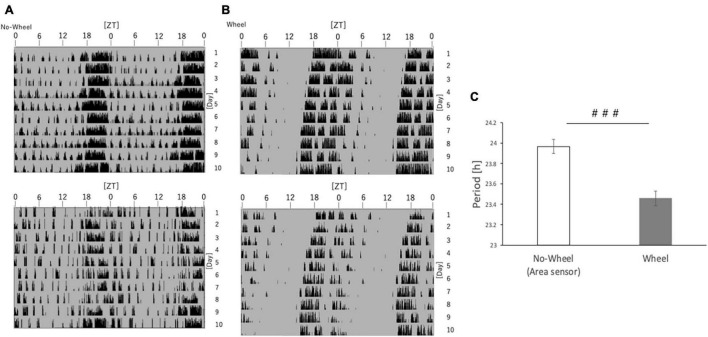
FIGURE 7.
Free-running cycle of mice under DD condition. (A) Representative double-plot actograms of the behavior of mice reared under DD conditions for 10 days as measured by an infrared sensor. (B) Representative double-plot actogram of behavior measured by a wheel-running device during 10 days of rearing under DD condition. (C) Free-run cycle calculated from behavioral rhythms. Data are presented as mean ± standard error of the mean (No-Wheel, n = 9; Wheel, n = 7). ###p < 0.001 (Mann-Whitney test).

