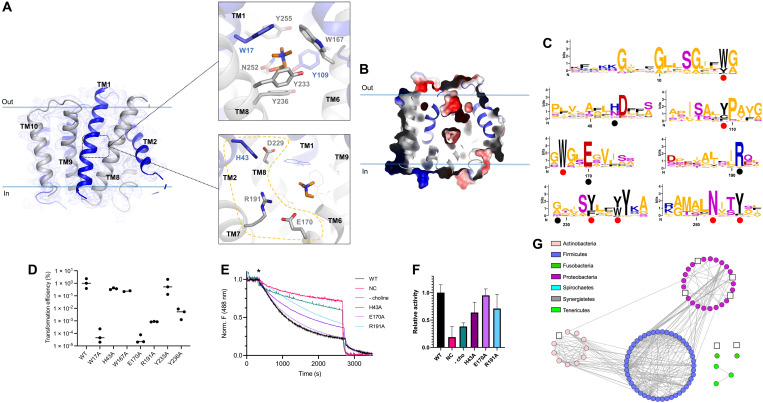
Fig. 4. Crystal structure of choline-bound occluded S. pneumoniae LicB.
(A) LicB and 2Fo-Fc electron density map contoured at 1.0 σ. Inverted repeats, TM1 to TM5 and TM6 to TM10, are indicated in blue and gray, respectively. Top: Choline binding site. Choline is shown in orange. Bottom: Charged residues in the vicinity of the choline binding site. (B) Surface electrostatic potential representation of LicB showing the central cavity closed to both sides of the membrane. Choline is shown in orange. (C) Sequence logos of the regions containing the choline binding residues (red dots) and charged residues around the central cavity (black dots). Sequences are from LicB proteins analyzed in Fig. 1B (see fig. S1). The y axis denotes positional information in bits. (D) Transformation efficiency assays of S. pneumoniae D39V ∆licB cells complemented with WT Plac-licB or variants (n = 3). (E) Proton transport assay with WT LicB and variants in proteoliposomes. Representative time courses are shown (n = 3). H+ influx was induced by establishing a membrane potential by the addition of the potassium ionophore valinomycin (asterisk). NC indicates negative control (protein-free liposomes). (F) Relative activity of proton transport as in (E). Values after reaching equilibrium at approximately 2700 s were compared (n = 3). Colors correspond to the traces shown in (E). (G) Sequence similarity network as in Fig. 1B, showing bacteria species where residues E170 and R191 are not conserved (white squares, see fig. S1).

