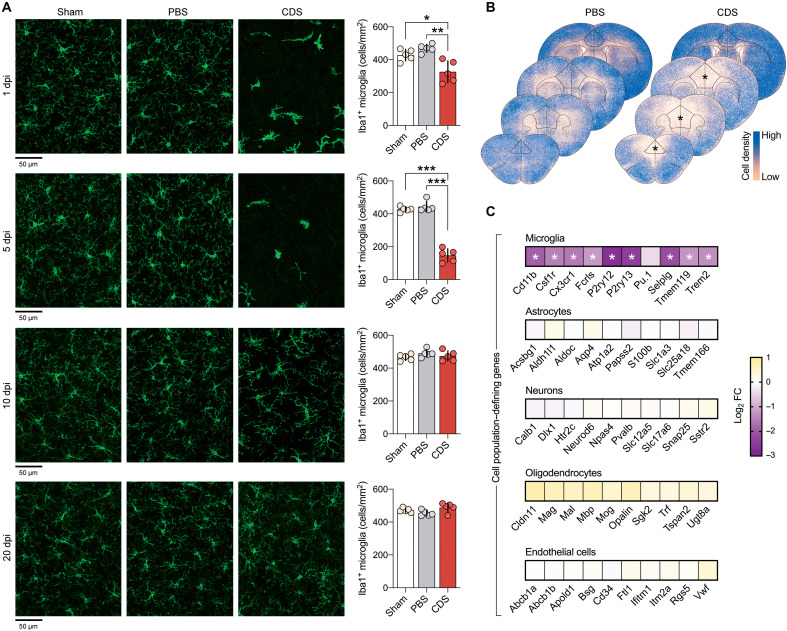
Fig. 1. Effectiveness, transiency, and selectivity of CDS-induced microglia depletion in the PFC of adolescent mice.
(A) Representative images of Iba1+ microglia (green) in the medial PFC of adolescent mice receiving sham surgery or bilateral intra-PFC injection of PBS or CDS. The images were taken 1, 5, 10, and 20 days post-injection (dpi). The bar graphs show the number of Iba1+ microglia in the medial PFC at different dpi intervals. *P < 0.05, **P < 0.01, and ***P < 0.001 [post hoc tests following ANOVA at 1 dpi: F(2,12) = 12.7, P < 0.01; at 5 dpi: F(2,12) = 140.5, P < 0.001]; N = 5 mice per group and dpi. (B) Color-coded overlays of coronal PFC sections taken from five mice per group (PBS or CDS), wherein each dot represents an Iba1+ microglial cell. Note the reduction of microglial cell density in the medial portion of PFC of CDS mice, as indicated by the symbol (*). (C) Expression of genes [log2 fold change (FC)] defining microglia, astrocytes, neurons, oligodendrocytes, and endothelial cells in CDS relative to PBS mice at 5 dpi; significantly altered genes are denoted with the symbol (*), based on FDR q < 0.05, as provided in fig. S6 and table S1; N = 5 mice per group.

