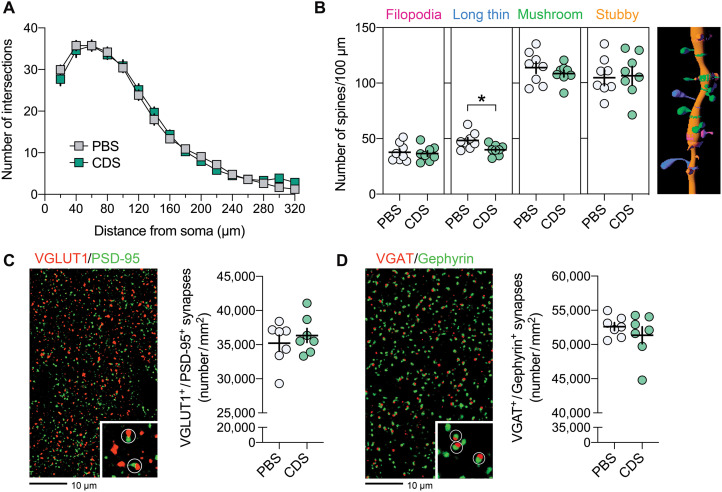
Fig. 7. Restricted structural synaptic changes in pyramidal neurons of the adult PFC after transient prefrontal microglia deficiency in preadolescence.
(A) The line plot depicts the number of dendritic intersections against the radial distance from soma (20-μm spacing from the soma center), as analyzed by Sholl analysis of biocytin-filled prefrontal neurons reconstructed with Imaris image analysis software. N = 8 per group. (B) Number of different spines (filopodia, long-thin, mushroom, and stubby spines), as analyzed by quantification of surface-rendered spines on biocytin-filled pyramidal dendritic sections. Different spine classes are highlighted in different colors, as shown on the representative IF stain of a biocytin-filled pyramidal dendritic section after surface rendering with Imaris. *P < 0.05, t(14) = 2.66; N = 8 per group. (C) Representative double-IF stain using VGLUT1 (red) as presynaptic and PSD-95 (green) as postsynaptic markers of excitatory neurons. VGLUT1+/PSD-95+ colocalizing synapses are highlighted by white circles in the magnified section. The scatterplot shows the density (numbers per square millimeter) of VGLUT1+/PSD-95+ synapses in the medial PFC of PBS and CDS mice. N = 7 per group. (D) Representative double-IF stain using VGAT (red) as presynaptic and Gephyrin (green) as postsynaptic markers of inhibitory neurons. VGAT+/Gephyrin+ colocalizing synapses are highlighted by white circles in the magnified section. The scatterplot shows the density (numbers per square millimeter) of VGAT+/Gephyrin+ synapses in the PFC of PBS and CDS mice N = 7 per group.

