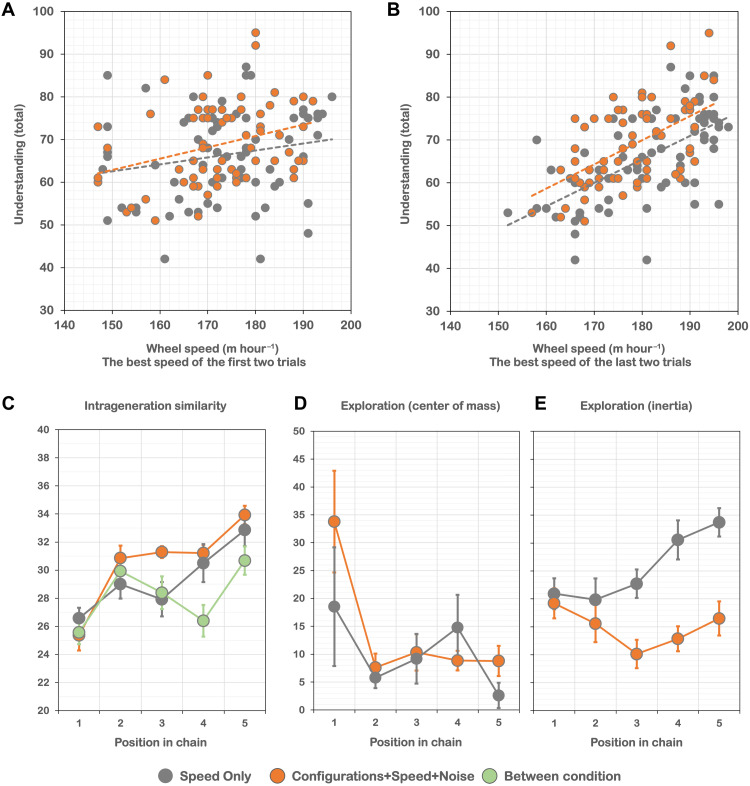
Fig. 3. Links between the wheel speed and the understanding scores and increase of intrageneration similarity and exploration scores over generations.
(A and B) Links between the wheel speed [(A) the best speed of the first two trials; (B) the best speed of the last two trials] and the understanding scores (total). (C) Intrageneration similarity scores over generations (Within condition: Speed-Only condition, gray; Configurations+Speed+Noise condition, orange; Between condition: green). (D and E) Exploration scores [(D) center of mass; (E) inertia] over generations. Error bars indicate standard errors.

