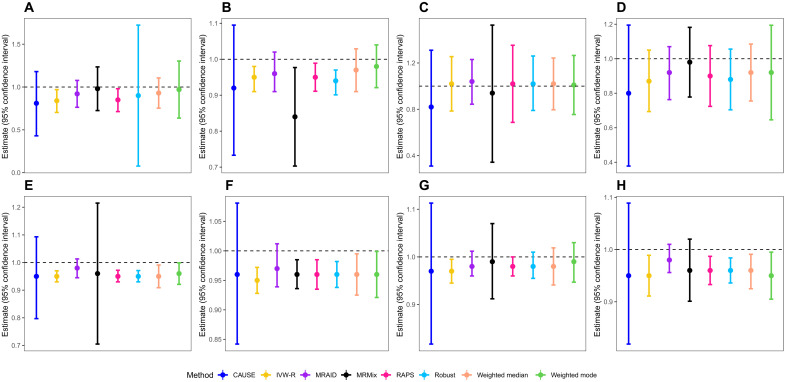
Fig. 4. Point estimates and 95% CIs from different MR methods in the trait on itself analysis in the real data.
Compared methods include CAUSE (blue), IVW-R (gold), MRAID (purple), MRMix (black), RAPS (deep pink), Robust (deep sky blue), Weighted median (light salmon), and Weighted mode (green). Analyzed trait pairs include SBP-SBP (A), BMI-BMI (B), DBP-DBP (C), pulse rate-pulse rate (D), TC-TC (E), LDL-LDL (F), TG-TG (G), and HDL-HDL (H). The horizontal black dashed line in each panel represents the true causal effect size of α = 1. Both MRAID and CAUSE can produce 95% CIs that cover the true causal effects of all trait pairs, with CAUSE producing much larger CIs than MRAID.

