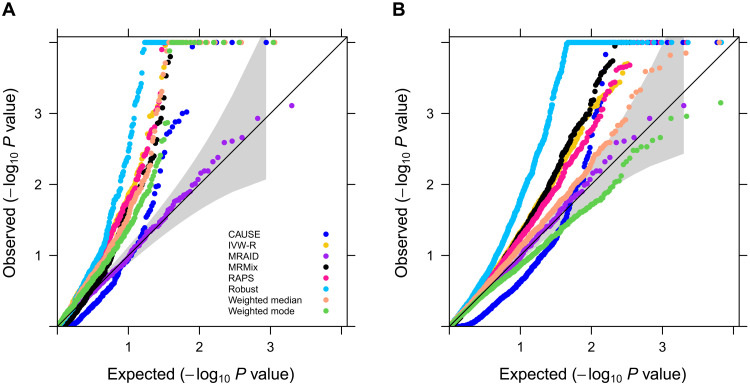
Fig. 5. Quantile-quantile plot of −log10 P values from different MR methods on testing the causal relationship between lifestyle risk factors and CVD-related traits in U.K. Biobank.
Compared methods include CAUSE (blue), IVW-R (gold), MRAID (purple), MRMix (black), RAPS (deep pink), Robust (deep sky blue), Weighted median (light salmon), and Weighted mode (green). The results are shown for all 645 analyzed trait pairs (A) and the empirical null where we permuted the outcome 10 times in the MR analysis of lifestyle traits on CVD-related traits (B).

