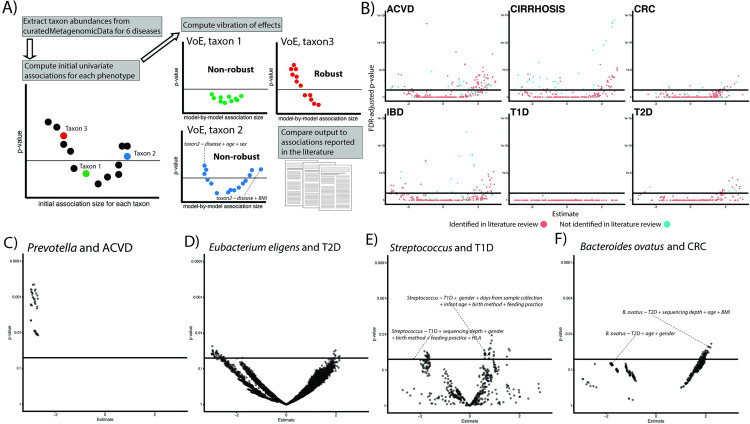
Fig 1.
(A) Overview of approach. We extract prevalent microbial features from our datasets and attempt to reproduce the findings from the literature by modeling VoE. We additionally review the literature for reported gut microbiome associations (their reported direction of correlation) with 6 diseases of interest. (B) Volcano plots showing the output from the initial, univariate associations. Point color corresponds to if an association was identified in our literature review solid line represents FDR significance (adjusted p < 0.05). (C–F) Examples of robust (C) and nonrobust associations. Each point represents a different modeling strategy. Solid line is nominal (p < 0.05) significance. This figure can be generated using the code deposited in https://github.com/chiragjp/ubiome_robustness and the data deposited in https://figshare.com/projects/Microbiome_robustness/127607. ACVD, atherosclerotic cardiovascular disease; CIRR, cirrhosis; CRC, colorectal cancer; FDR, false discovery rate; IBD, inflammatory bowel disease; T1D, type 1 diabetes; T2D, type 2 diabetes; VoE, vibration of effects.

