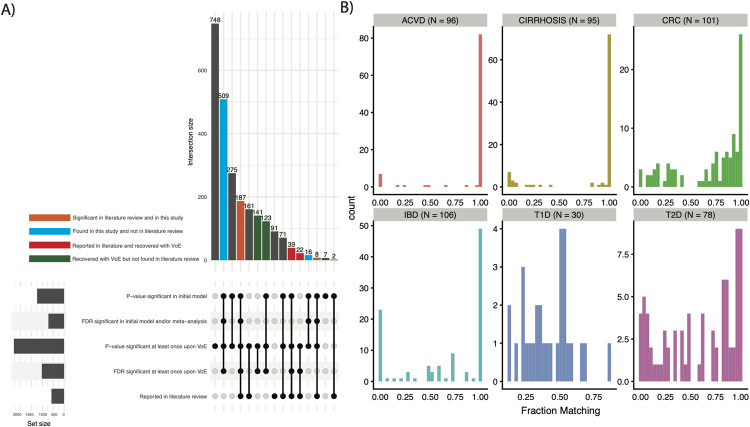
Fig 2. Comparing single modeling approaches to modeling VoE.
(A) Stratifying features by their being identified in our literature review, p-value/FDR significant (<0.05) in our initial analysis, or having at least 1 significant model upon vibrations. The gray bars labeled “set size” indicate the number of features associated with a given row in the bottom of the plot (e.g., about 1000 features were p-value significant in the initial model). The gray bars in the upper portion of the panel are those we chose not to highlight, as they do not fall into any category indicated by the colors or referenced in the manuscript. (B) Distribution of fraction of models matching literature review–defined direction of associations. This figure can be generated using the code deposited in https://github.com/chiragjp/ubiome_robustness and the data deposited in https://figshare.com/projects/Microbiome_robustness/127607. ACVD, atherosclerotic cardiovascular disease; CRC, colorectal cancer; FDR, false discovery rate; IBD, inflammatory bowel disease; T1D, type 1 diabetes; T2D, type 2 diabetes; VoE, vibration of effects.

