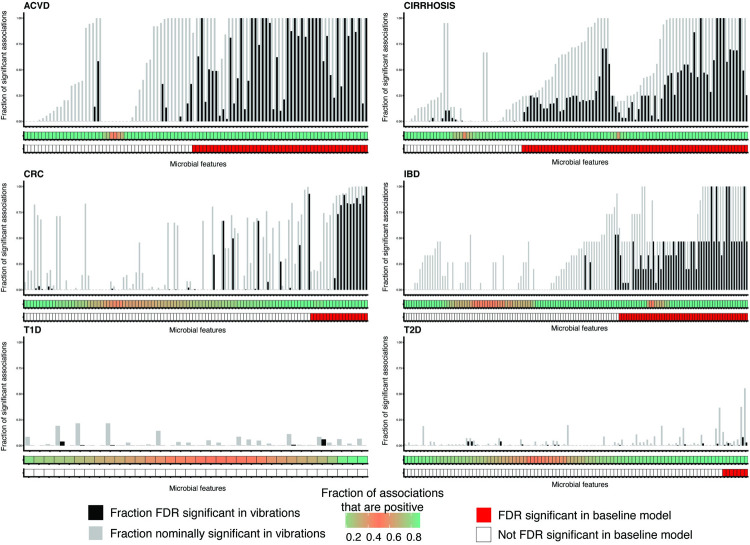
Fig 3. VoE for reported associations from the literature in the form of summarized modeling output.
(A) We measure association robustness in part by computing the fraction of associations with signs greater than 0. These values show the distributions of these values for each microbial taxon). (B) Summarized modeling output. Red blocks indicate organisms that were FDR significant in our study. The middle bar describes the fraction of association sizes greater than 0 per taxon: a highly confounded association will be closer to 0.5 and pink, whereas more robust associations will be closer to 0 or 1 and green. The gray bars in the upper bar plot corresponds the fraction of models that were nominally (p-value < 0.05) significant for the microbial feature–disease association, whereas the black bars correspond to the fraction of models that were FDR significant. Features marked as significant in our study but never FDR significant were only significant after the meta-analysis and did not have any nominal significant p-values. See S2 Fig for this plot reproduced with species names on the x-axis. This figure can be generated using the code deposited in https://github.com/chiragjp/ubiome_robustness and the data deposited in https://figshare.com/projects/Microbiome_robustness/127607. ACVD, atherosclerotic cardiovascular disease; CRC, colorectal cancer; FDR, false discovery rate; IBD, inflammatory bowel disease; T1D, type 1 diabetes; T2D, type 2 diabetes; VoE, vibration of effects.

