
Fig 4. The effects of different adjusters on human microbiome associations.
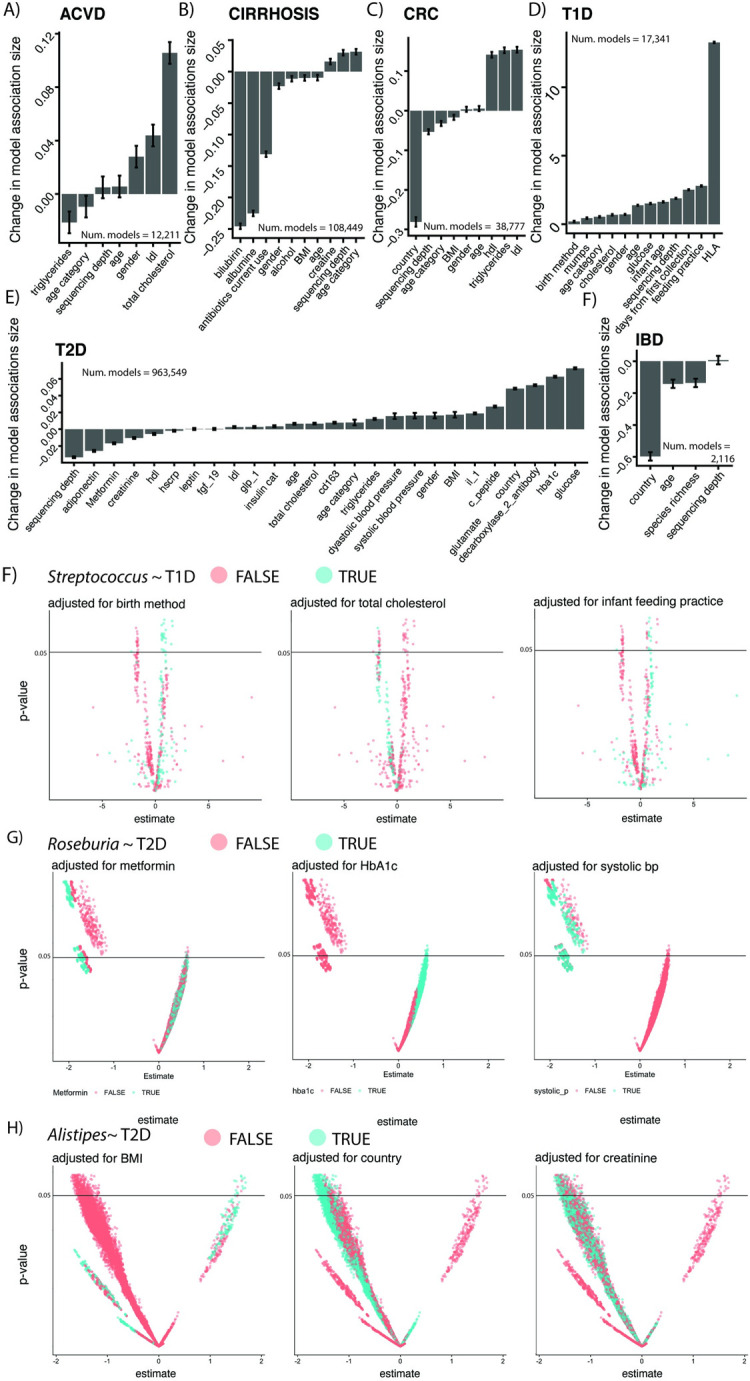
(A) Various adjusters for our diseases of interest. For each disease in our study, we report the change in the association sizes between microbiome features and disease as a function of adjusting variable presence or absence (See Methods). Each individual plot summarizes the output for the 2^n models fit for each feature within a given disease, where n = number of adjusters. The y-axis corresponds to the mean change in Beta coefficient (in units of relative abundance) on the independent, binary disease outcome when a given adjusting variable (x-axis) is included in the model. (B–D) Visualization of the impact of the presence/absence of different confounders for 3 organisms and their associations with T1D/T2D. This figure can be generated using the code deposited in https://github.com/chiragjp/ubiome_robustness and the data deposited in https://figshare.com/projects/Microbiome_robustness/127607. ACVD, atherosclerotic cardiovascular disease; BP, blood pressure; CRC, colorectal cancer; IBD, inflammatory bowel disease; T1D, type 1 diabetes; T2D, type 2 diabetes.