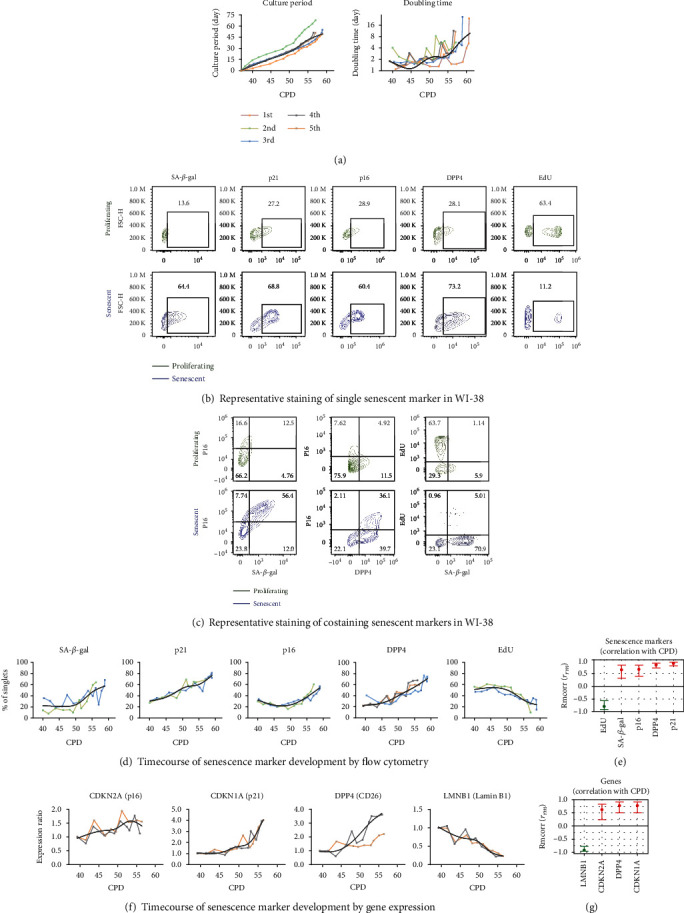
Figure 1.

The timecourse of senescence marker expression with the serial culture of the WI-38 replicative senescence cell model system. Human diploid fibroblast WI-38 cells were profiled for senescence markers by flow cytometry and qPCR. Each serial culture is represented in a different color; the trend-line for expression of each marker was created by a smoothing spline function with 5 knots. (a) Serial culture of WI-38 was performed from CPD 37 to senescent status (CPD 56–60) for a total of 5 times. Doubling time increased during the serial culture. (b) and (c) SA-β-gal activity, protein expression of p21, p16, DPP4, and EdU proliferation markers detected by flow cytometry in proliferating (CPD 40-42, dark green) and senescent (CPD 56-60, blue) WI-38, both individually as single markers (b) or combined (c). Compared to proliferating WI-38, senescent WI-38 expressed higher SA-β-gal activity, p21, p16, DPP4 protein, and lower EdU (b). In the senescent WI-38, p16 protein was positively co-expressed with SA-β-gal activity and DPP4; SA-β-gal activity was negatively correlated with the proliferation marker EdU (c). (d) and (f) Serial culture of WI-38 from proliferating to senescent status was done repeatedly to characterize the timecourse of senescence marker development by flow cytometry and qPCR. There are no qPCR equivalents for SA-β-gal activity or EdU; however, Lamin B1 (LMNB1) was quantified by qPCR to provide a gene expression representation of cell proliferation and senescence. (e) and (g) The associations of senescence markers and genes with CPD were evaluated by repeated measures correlation (Rmcorr). The Rmcorr correlation efficient (rrm) of CPD with senescence markers (% of total cells) and genes (expression ratio) is depicted for analyses adjusted for repeated measurements. Green: negative correlation. Red: positive correlation.
