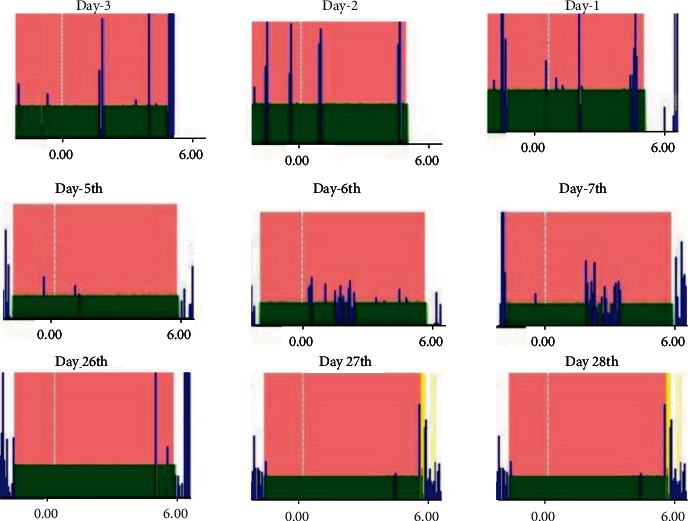
Figure 4.

Real-time effects of acupuncture on sleep efficiency. ActiGraph diagrams monitoring the sleep efficiency of a representative patient from the Acutreatment group on day -3 to day -1 before treatment start and after treatment start, on days when acupuncture was interrupted (days 5/6 and days 26/27), and the first day of treatment reonset (day 7 and day 28). Blue peaks represent activity; x − axes = time: 24 hours of ActiGraph measurement, with focus on the night time (vertical white dotted line = midnight).
