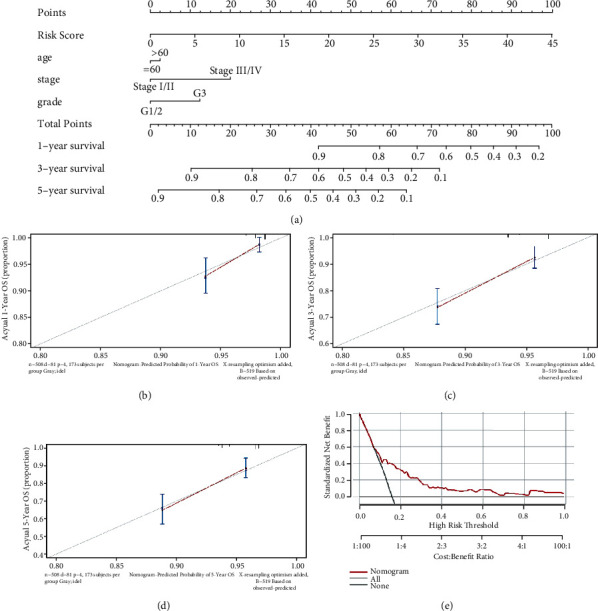
Figure 6.

Construction of a nomogram model in TCGA dataset. (a) A nomogram for predicting the 1-, 3-, and 5-year overall survival rates of EC patients. (b–d) The calibration curve at 1, 3, and 5 years. (e) A DCA curve was used to evaluate the accuracy of the nomogram model.
