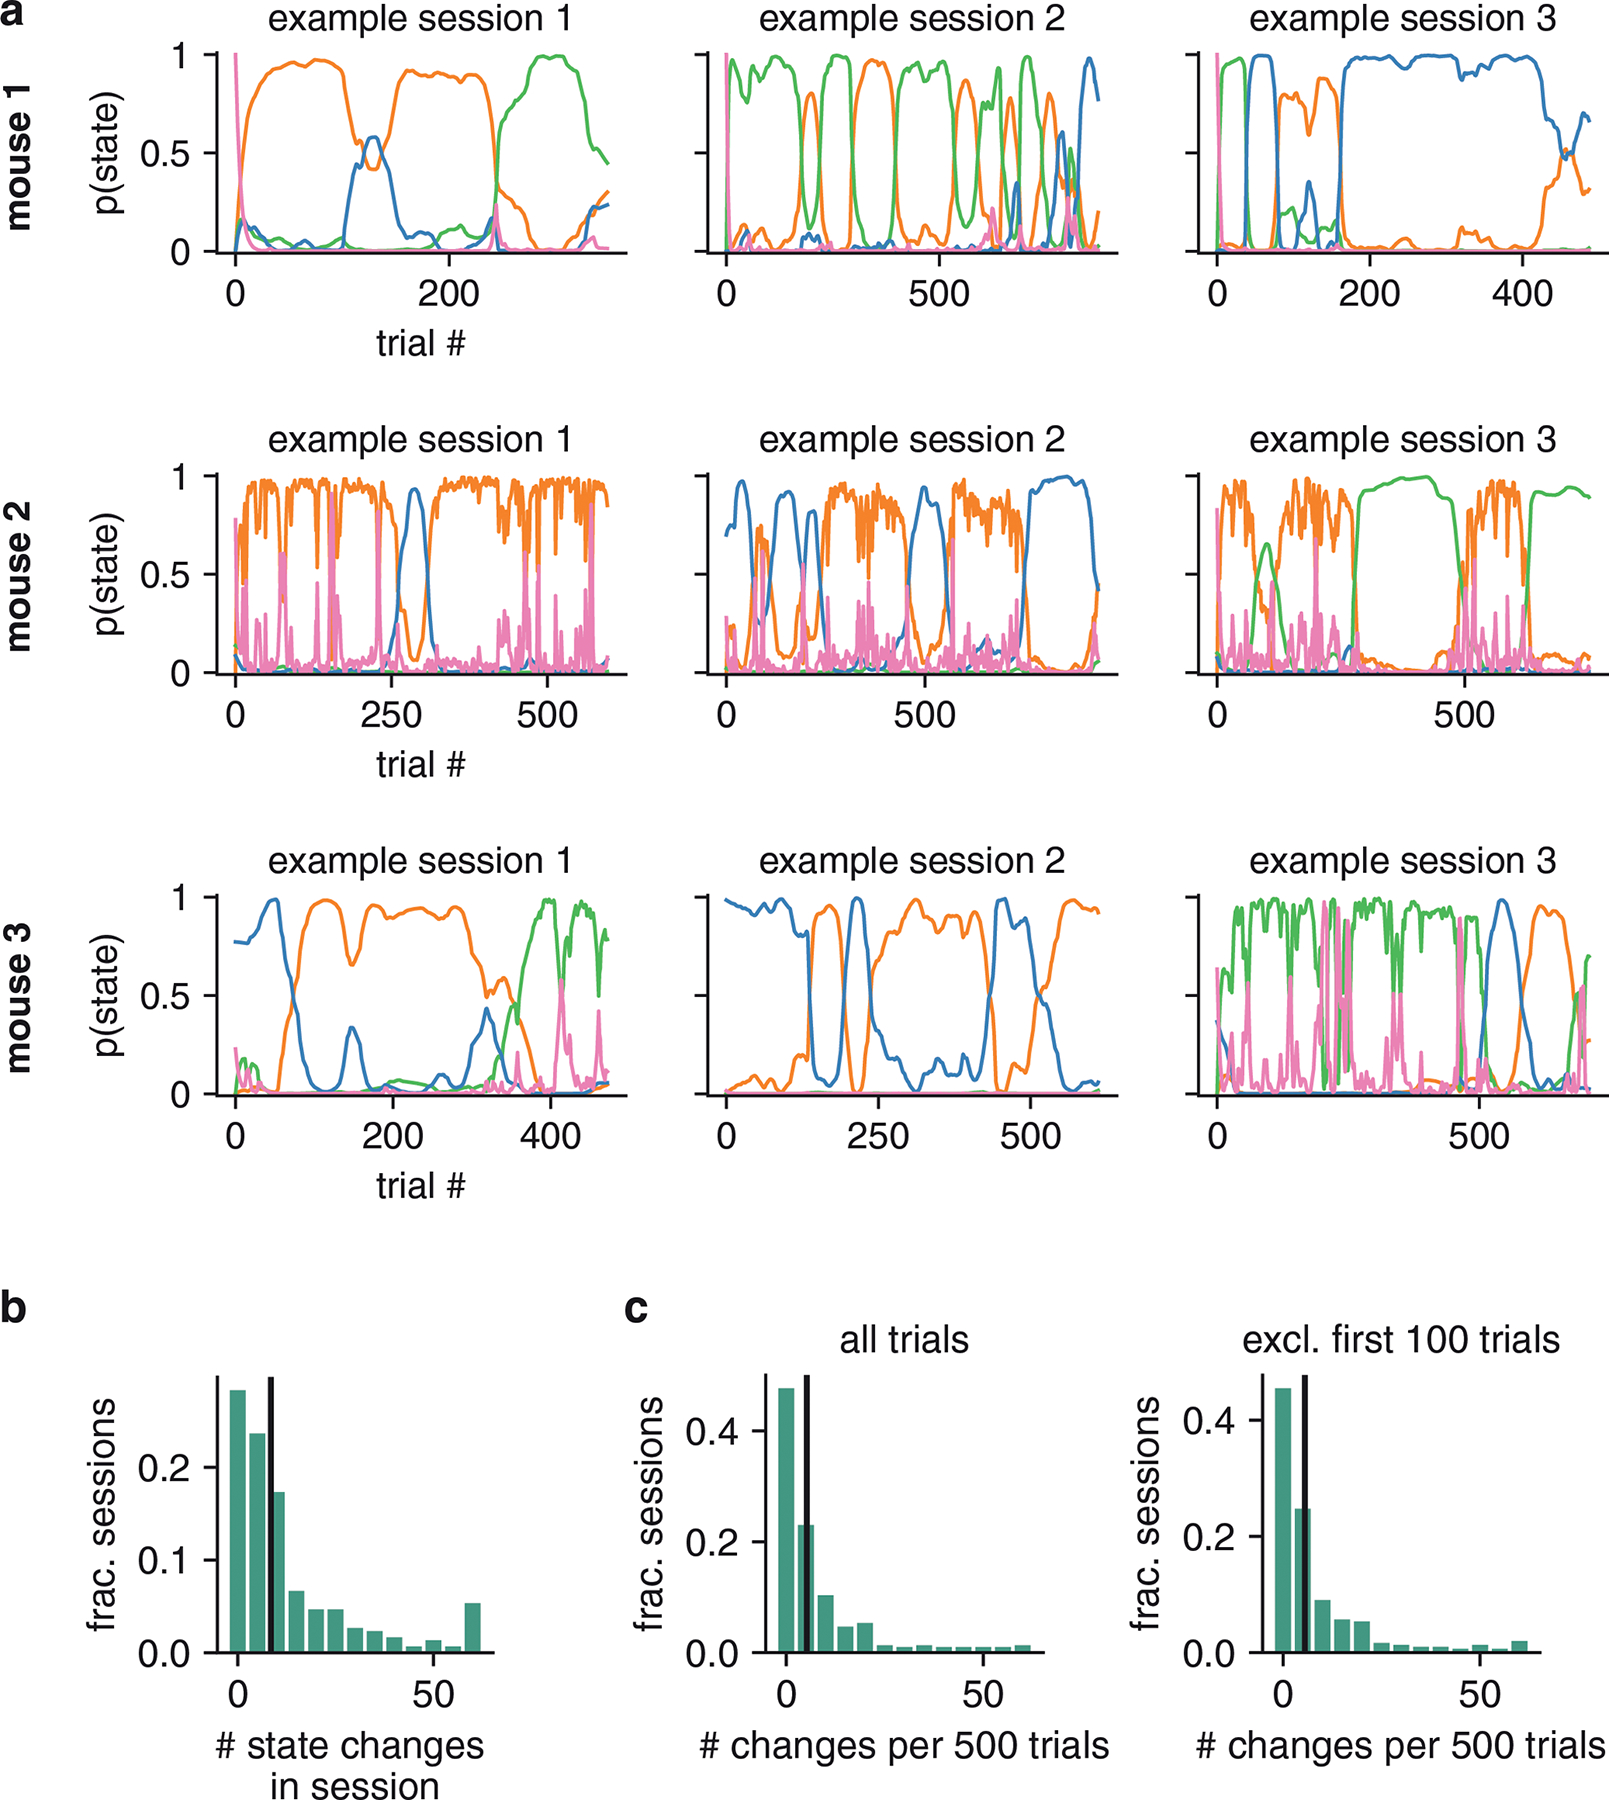
Figure ED5: State switching in Odoemene et al. task.

(a) Posterior state probabilities for three example sessions for three example mice (different mice are shown in each row). (b) Histogram giving number of state changes (identified with posterior state probabilities) per session for all sessions across all animals. For visibility, state changes are censored above 60. (c) Different sessions have different numbers of trials, so we normalize the histogram of b to give the number of state changes per 500 trials for each session (the median session length is 683 trials). Again, for visibility, state changes are censored above 60. Left: we use all data from all trials to generate the normalized histogram. Right: we plot the normalized histogram when we exclude the first 100 trials of a session. As can be observed, the left and right normalized histograms are very similar (p-value = 0.96 using KS-test). While the GLM-HMM is able to capture “warm-up” effects (as described in the main text), this test reveals that the GLM-HMM is able to capture more than this, and state switching occurs much later in the session too (as also indicated by the posterior state probabilities shown in a).
