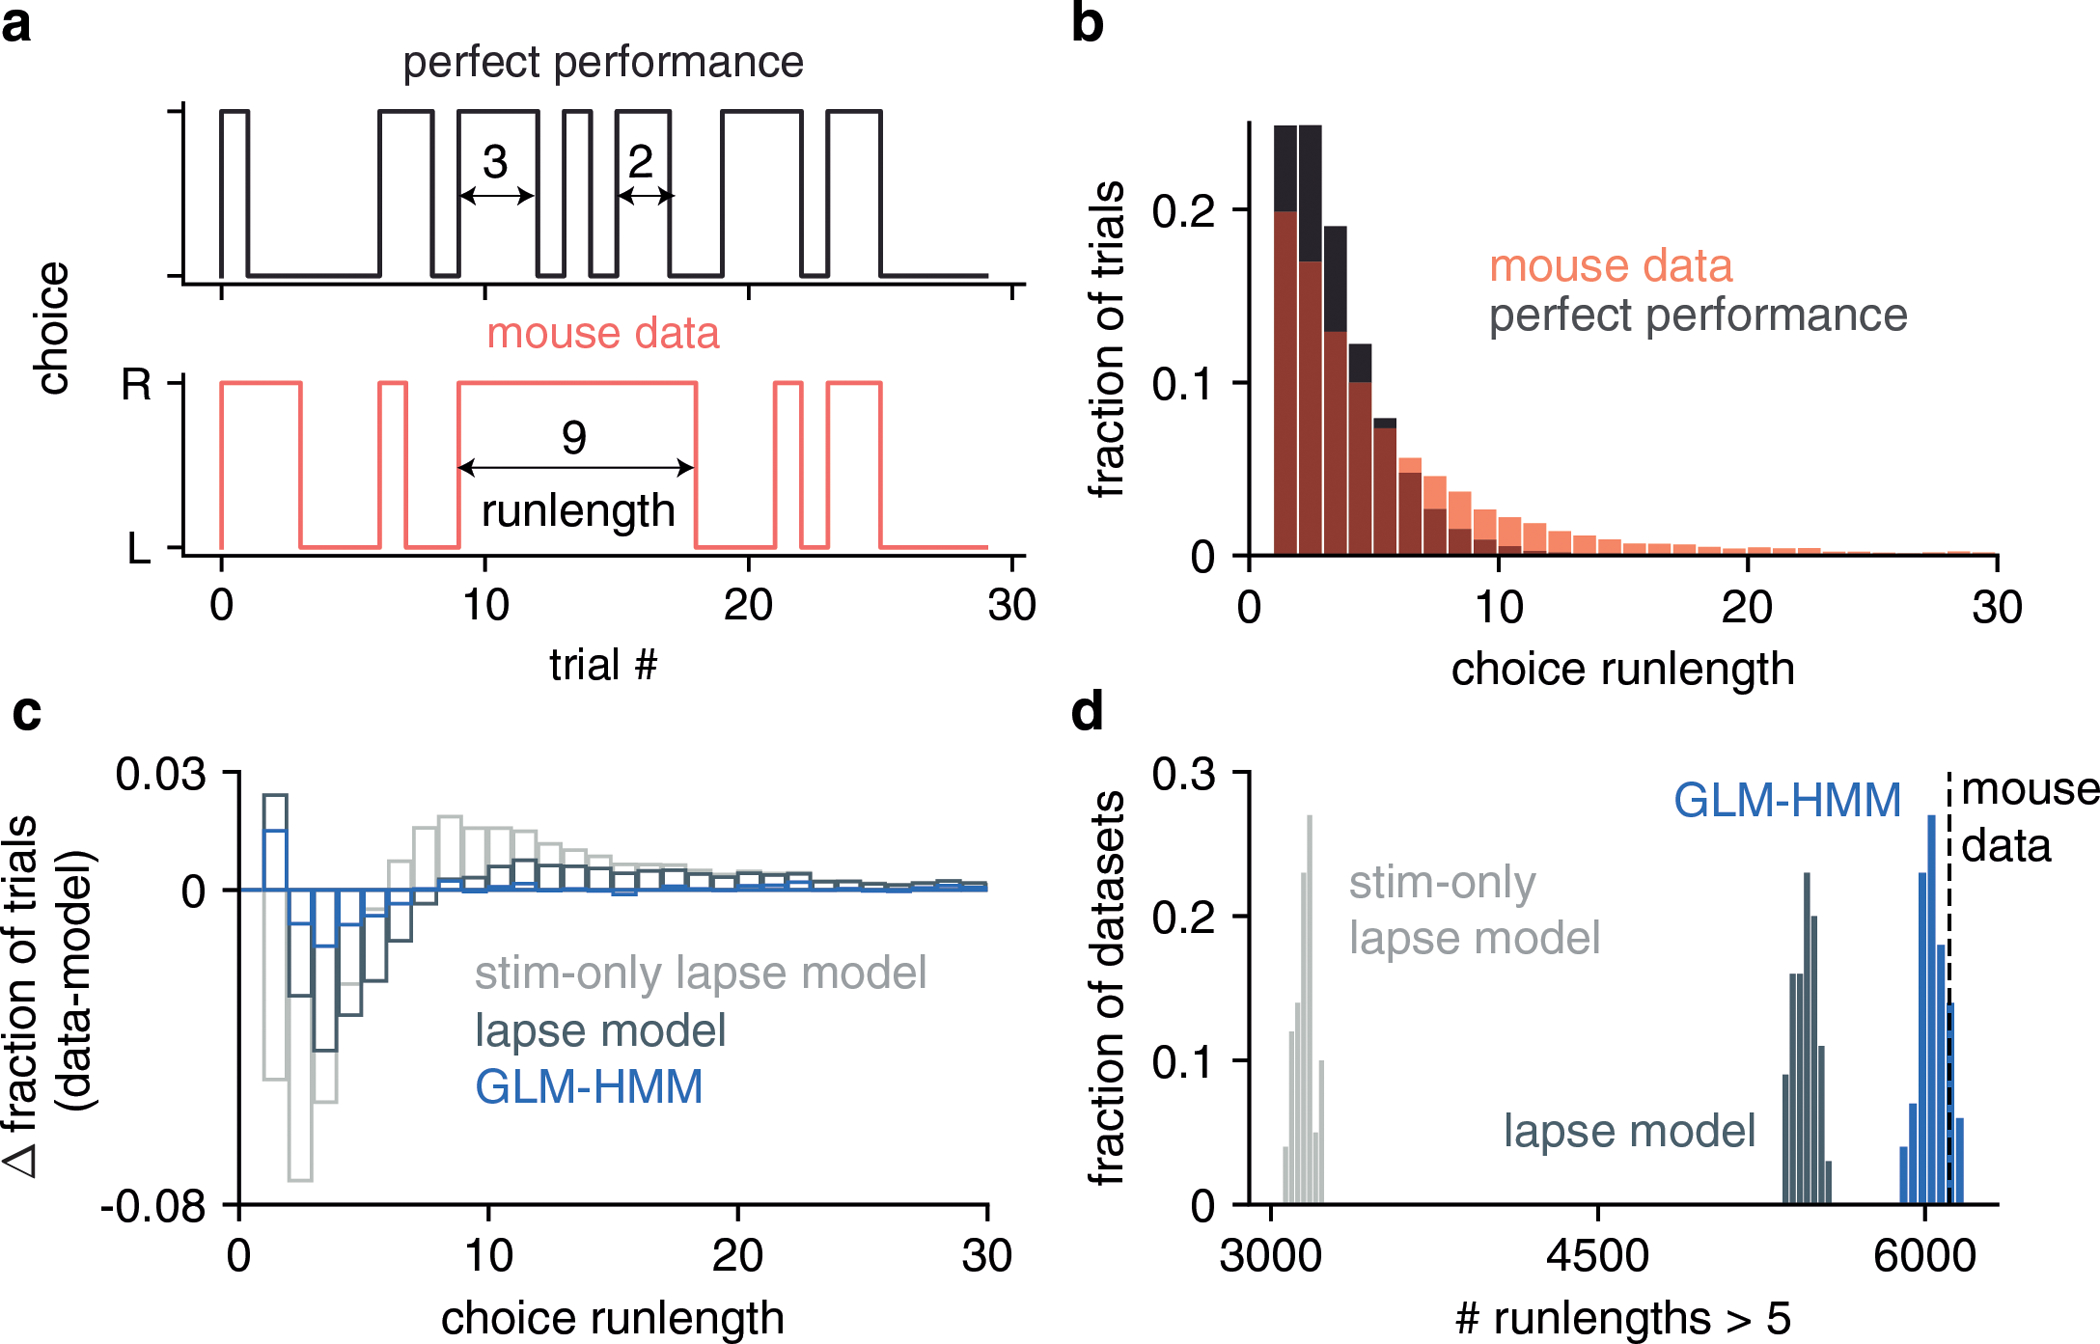
Figure ED8: Simulated data from GLM-HMM captures statistics of real choice data.

(a) Definition of choice run-length. Shown are the choices that an IBL mouse made over the course of 30 trials (red, bottom), as well as the choices it should have made during that same time course if the mouse performed the task perfectly (grey, top). Choice run-length is defined as the number of trials during which a mouse repeated the same decision (example choice run-lengths of 2, 3 and 9 trials are highlighted). (b) Red: fraction of trials in choice run-lengths of between 1 and 30 trials when calculated from all trials for all mice. Grey: distribution of choice run-lengths that would have been obtained if IBL mice performed the task perfectly. (c) Difference in choice run-length distribution for simulated data (from three different models) compared to the red distribution shown in (b). Models used to simulate data were a lapse model with only stimulus intensity and bias regressors, a lapse model that also included history regressors (previous choice and win-stay-lose-switch), and a 3 state GLM-HMM (also with history regressors). We simulated 100 example choice sequences from each model and calculated the mean histogram of choice run-lengths across the 100 simulations. This was then subtracted from the red histogram of (b). (d) Number of choice run-lengths with more than 5 trials for each model simulation used in (c). In the 181,530 trials of real choice data, there were 6111 run-lengths lasting more than 5 trials (as shown with the dashed line). When we simulated choice data according to each of the models shown in (c), we found that only the GLM-HMM could generate simulations with as many run-lengths lasting more than 5 trials as in the real data (15/100 simulations had 6111 or more run-lengths lasting more than 5 trials for the GLM-HMM compared to 0/100 for both of the lapse models).
