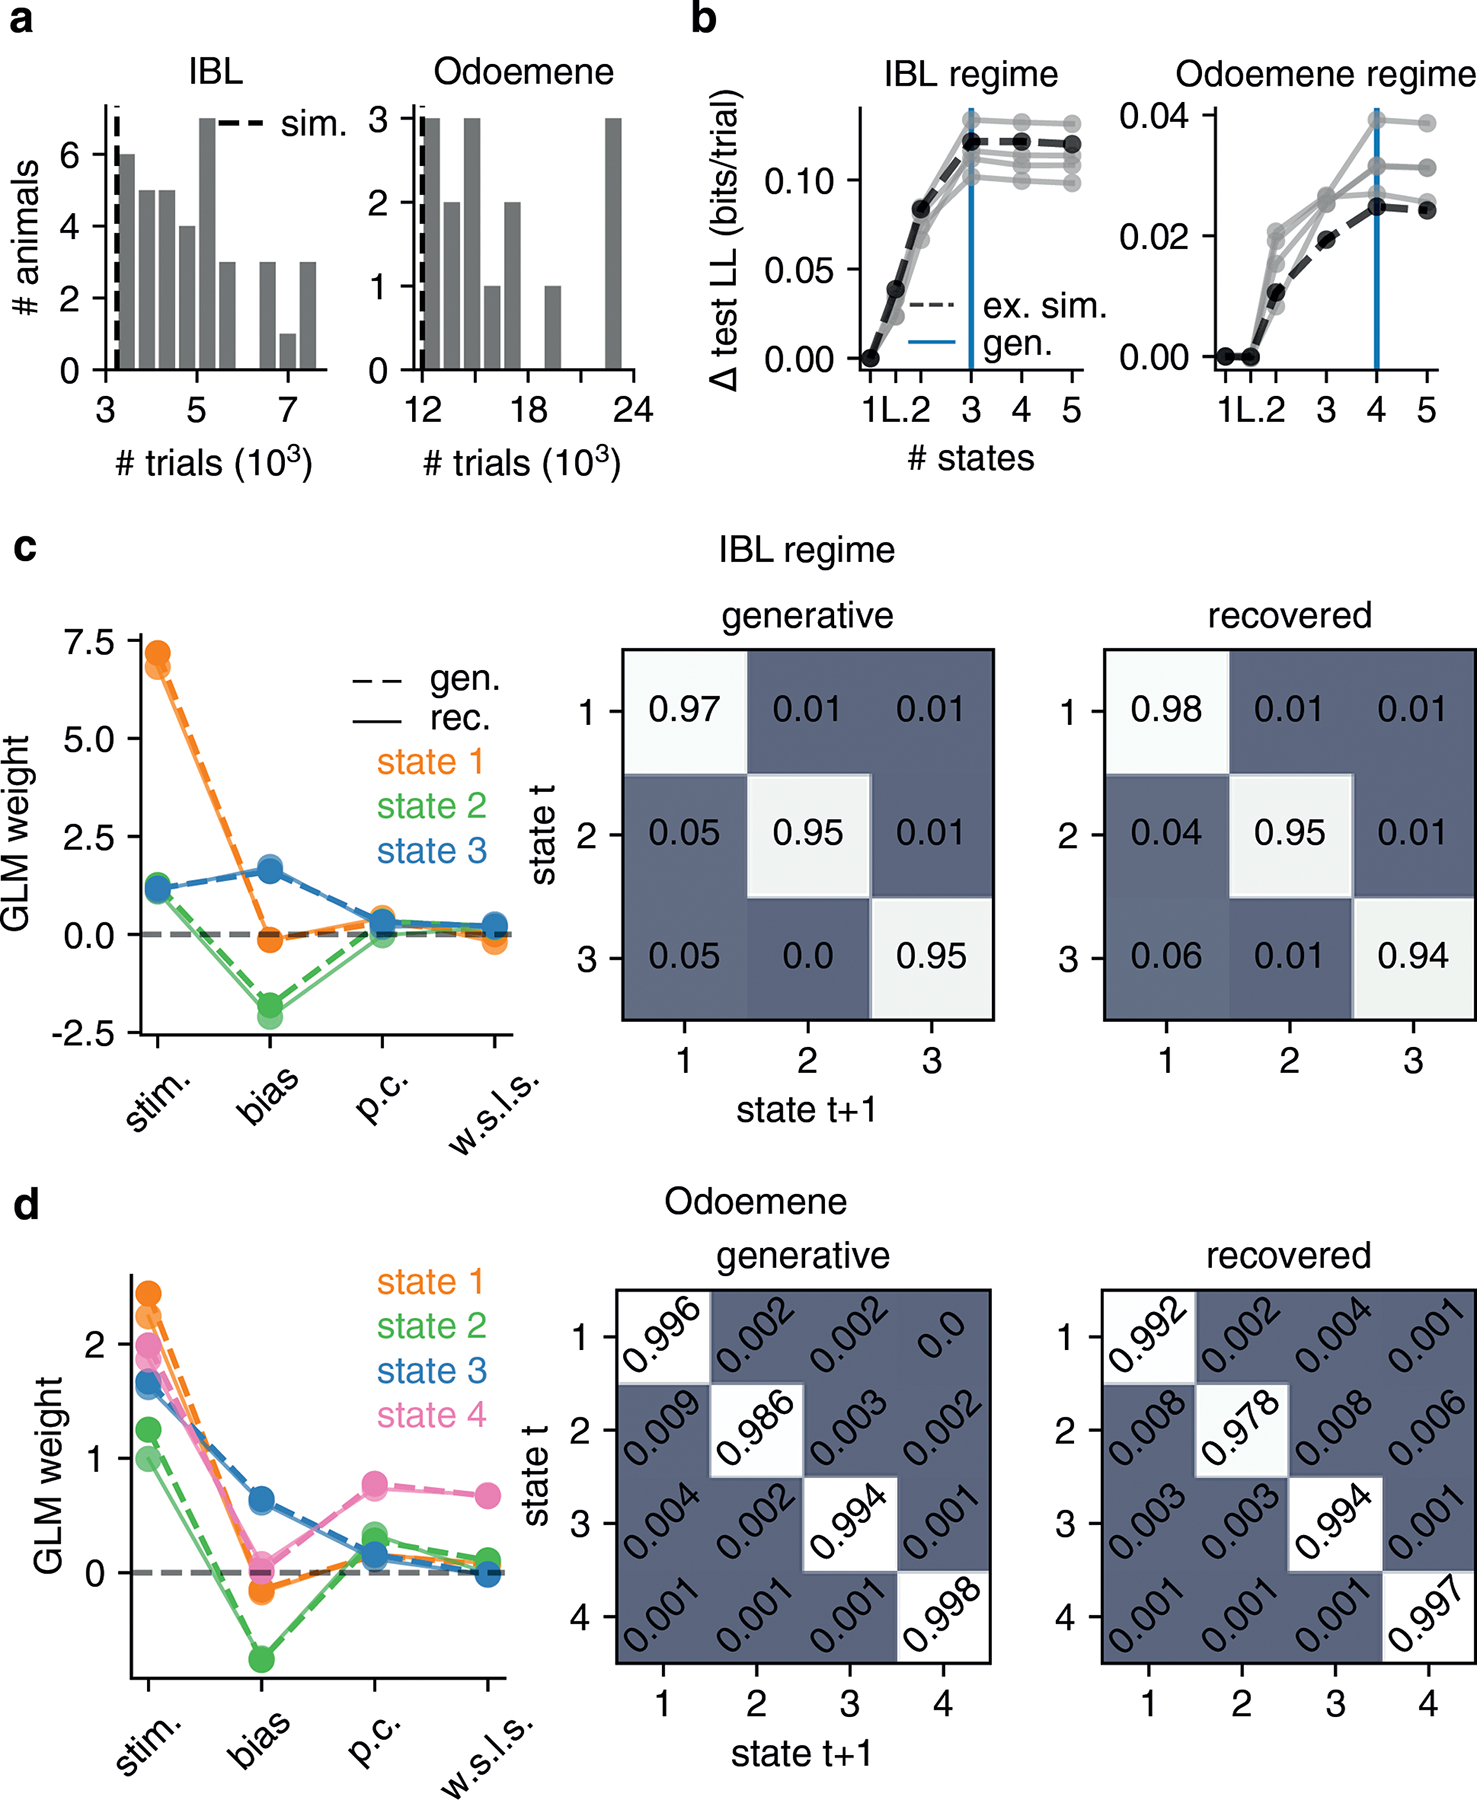
Figure ED9: GLM-HMM Recovery Analysis 1.

For dataset sizes comparable to those of real animals, we can recover the IBL and Odoemene global parameters in simulated data. (a) Dataset sizes for each of the 37 IBL animals studied (left) and 15 mice from Odoemene et al. (right). The dashed vertical line indicates the number of trials that we used in simulation data in panels b, c and d (3240 for the IBL parameter regime and 12000 for the Odoemene regime simulation). (b) Test set loglikelihood for each of 5 simulations is maximized at 3 states (blue vertical line) after we simulate according to the (IBL regime) parameters shown in panel c. Similarly, in the right panel, test set loglikelihood is maximized at 4 states when we simulate choice data with the (Odoemene regime) parameters shown in panel d. The thick black line marked as ‘ex. sim.’ (example simulation) indicates the simulation whose generative and recovered parameters we show in panels c and d. (c) Left: the generative and recovered GLM weights (for the simulation marked as ‘ex. sim.’ in panel b) when we simulate choice data in the IBL parameter regime. Middle and right: the generative and recovered transition matrices. (d) The generative and recovered parameters in the Odoemene et al. parameter regime.
