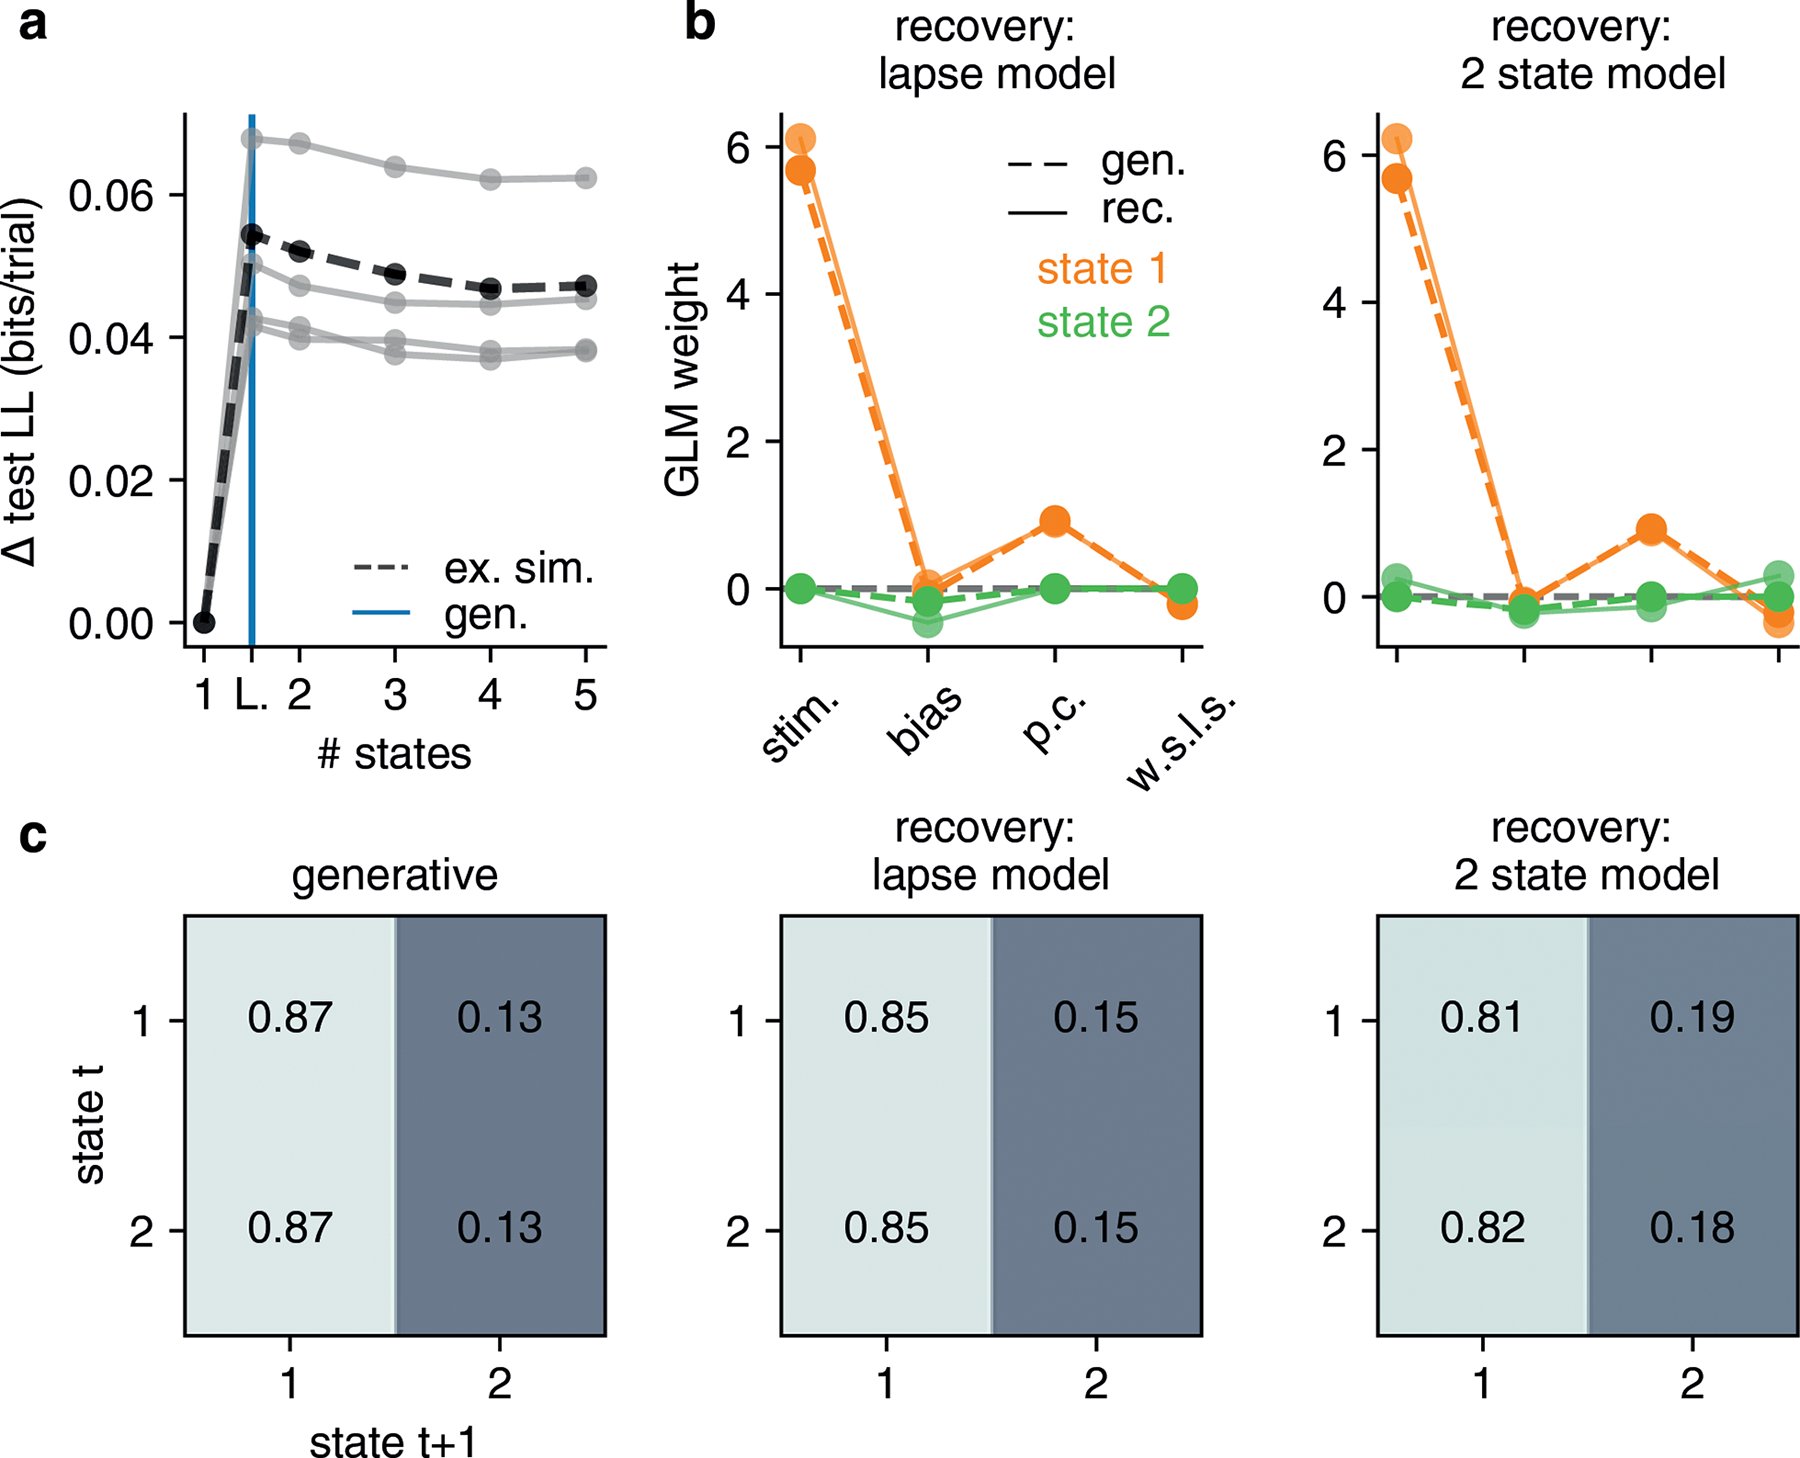
Figure ED10: GLM-HMM Recovery Analysis 2: We can recover lapse behavior.

(a) We simulate 5 datasets, each with 3240 trials, according to the best fitting lapse model for IBL animals. We then fit these simulated datasets with GLM-HMMs, as well as a lapse model (a constrained 2 state GLM-HMM). The test set loglikelihood is highest for the lapse model in all simulations, indicating that lapse behavior can be distinguished from the long-enduring multi-state behavior that best described the real data. The thick black line marked as ‘ex. sim.’ (example simulation) indicates the simulation whose generative and recovered parameters we show in panels b and c. (b) Left: the generative and recovered weights when recovery is with a lapse model. Right: the generative weights are the same as in the left panel, but we now recover with an unconstrained 2 state GLM-HMM (thus the stimulus, previous choice and w.s.l.s. weights for the second state can be non-zero) (c) The generative (left) transition matrix and the recovered transition matrices when we recover with a lapse model (middle) and an unconstrained 2 state GLM-HMM (right). While the lapse model and 2 state GLM-HMM results don’t perfectly agree, if mice were truly lapsing, the transition matrix would not have the large entries on the diagonals that we observe in the real data.
