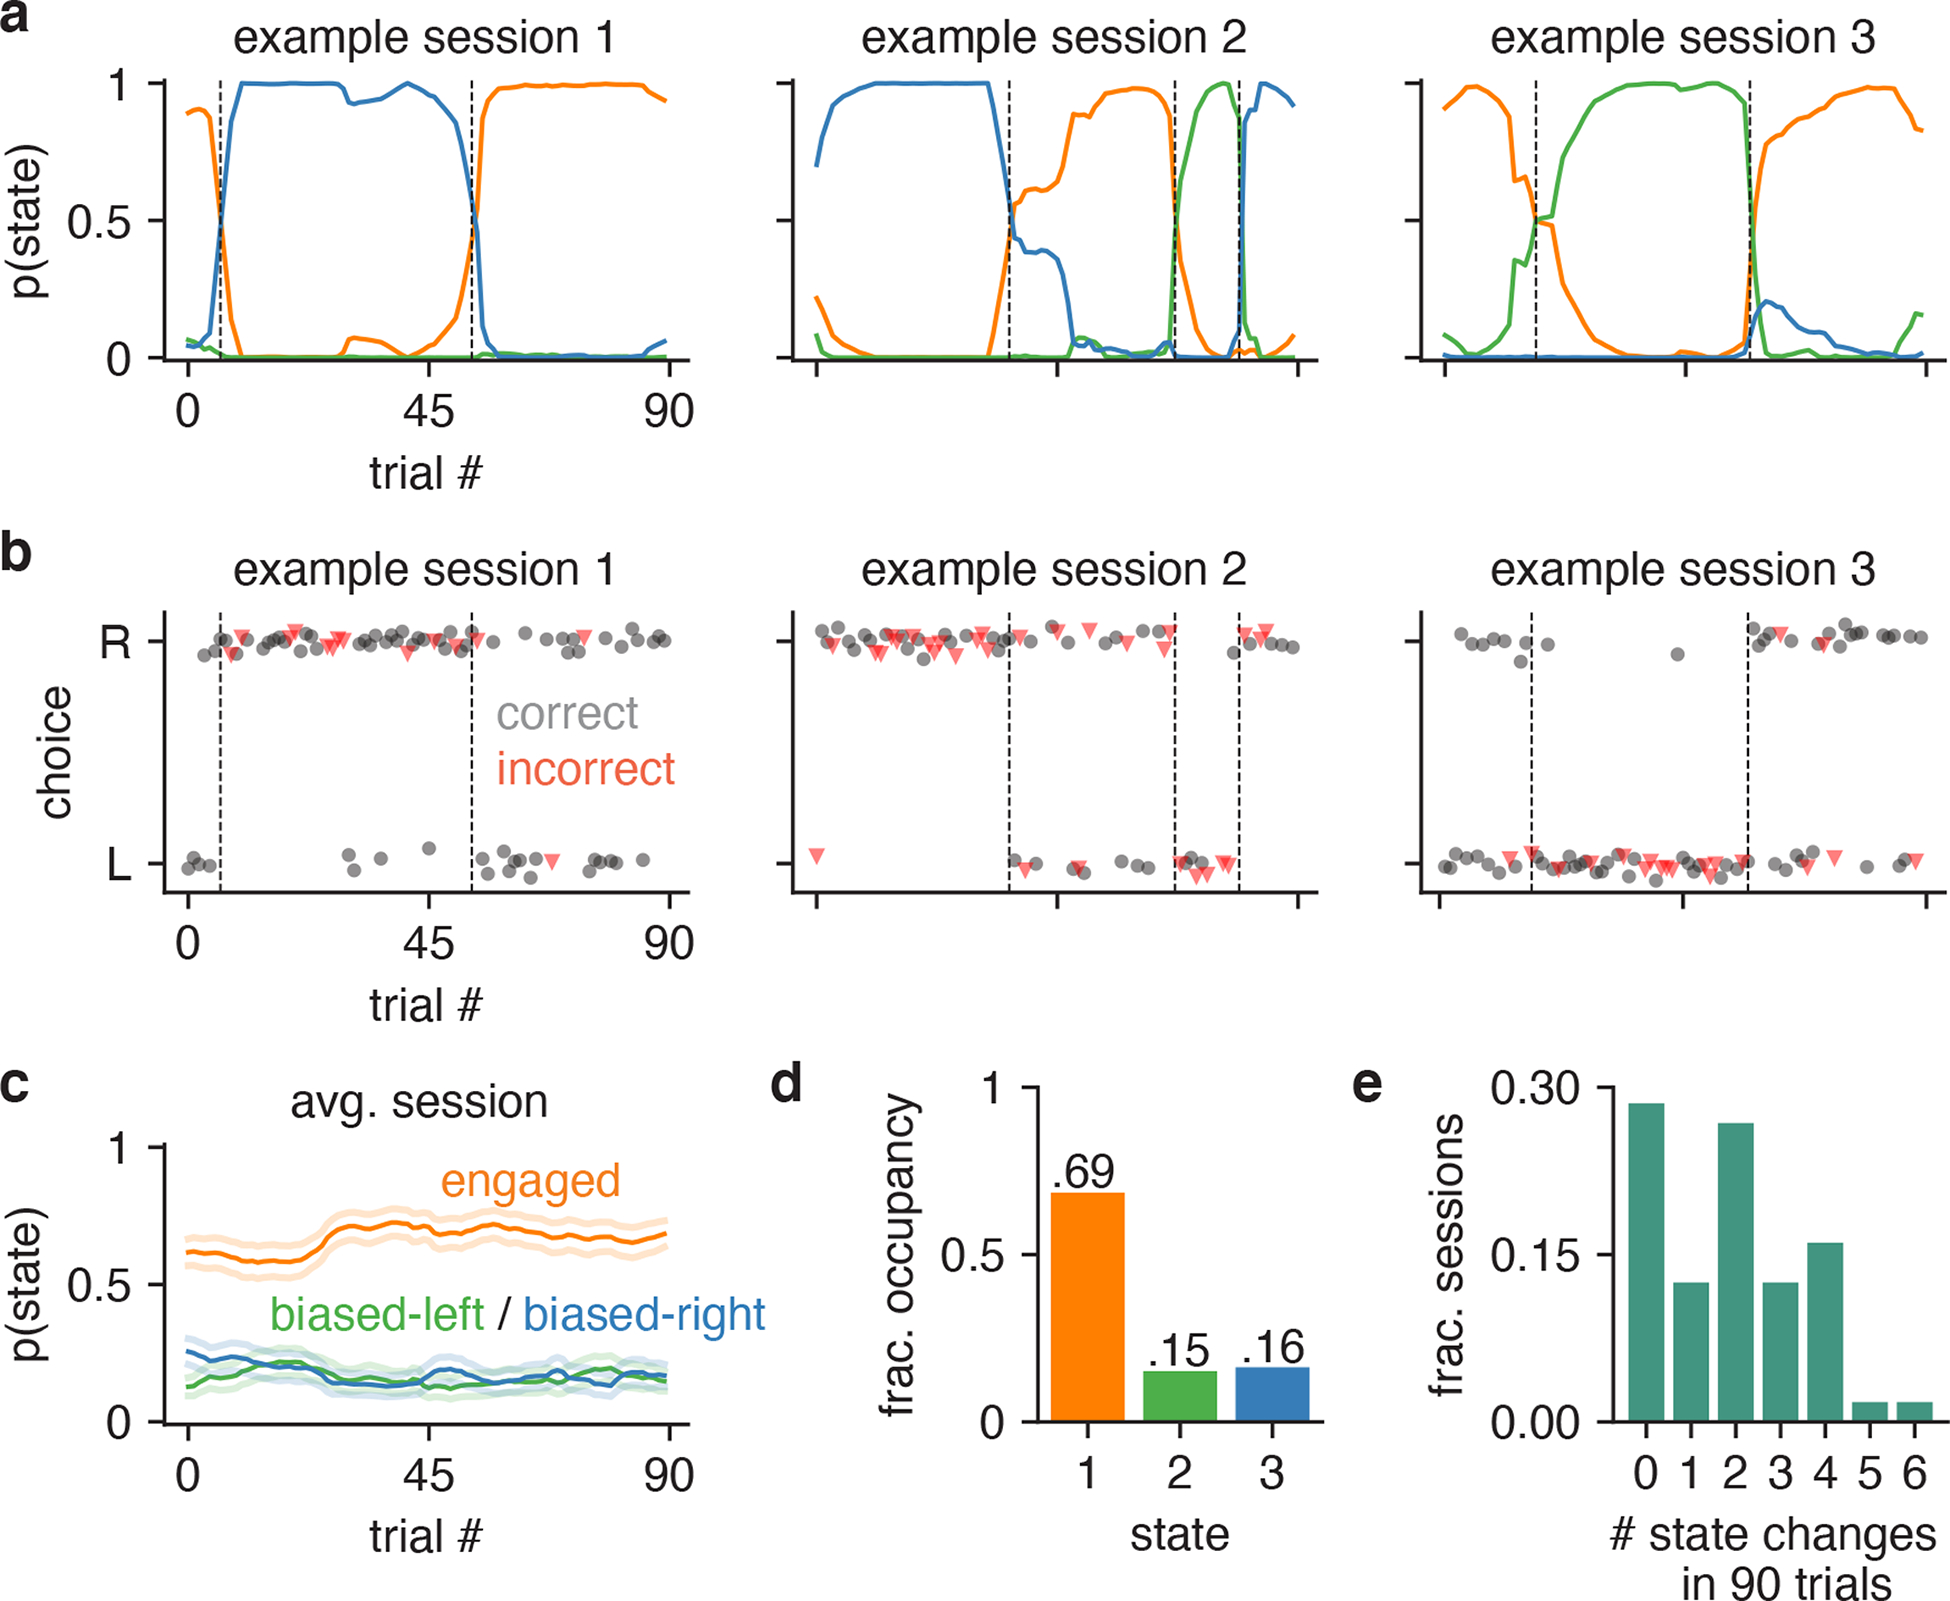
Figure 3: Inferred state dynamics for example IBL mouse.

(a) Posterior state probabilities for three example sessions, revealing high levels of certainty about the mouse’s internal state, and showing that states typically persisted for many trials in a row. (b) Raw behavioral data corresponding to these three sessions. Each dot corresponds to a single trial; the x-position indicates the trial within the session, while the y-position indicates if the mouse went rightward or leftward on the trial (y-positions are slightly jittered for visibility). The dot’s color and shape indicates if the trial was an error or correct trial (red triangles correspond to errors, while black circles represents correct choices). All trials except 0% contrast trials (for which the correct answer is determined randomly) are shown here. The dashed vertical lines correspond to the location of state changes (obtained using the posterior probabilities shown in a). (c) Average trajectories of state probabilities within a session, computed over 56 sessions. Error bars indicate ±1 standard error of the mean. (d) Fractional occupancies for the three states across all trials. For this analysis, we assigned each trial to its most likely state and then counted the fraction of trials assigned to each state. Overall, the mouse spent 69% of all trials in the engaged state, and 31% of trials in one of the two biased states. (e) Histogram showing the number of inferred state changes per session, for all 56 sessions of data for this mouse. Only 29% of sessions involved the mouse persisting in a single state for the entire 90-trial session.
