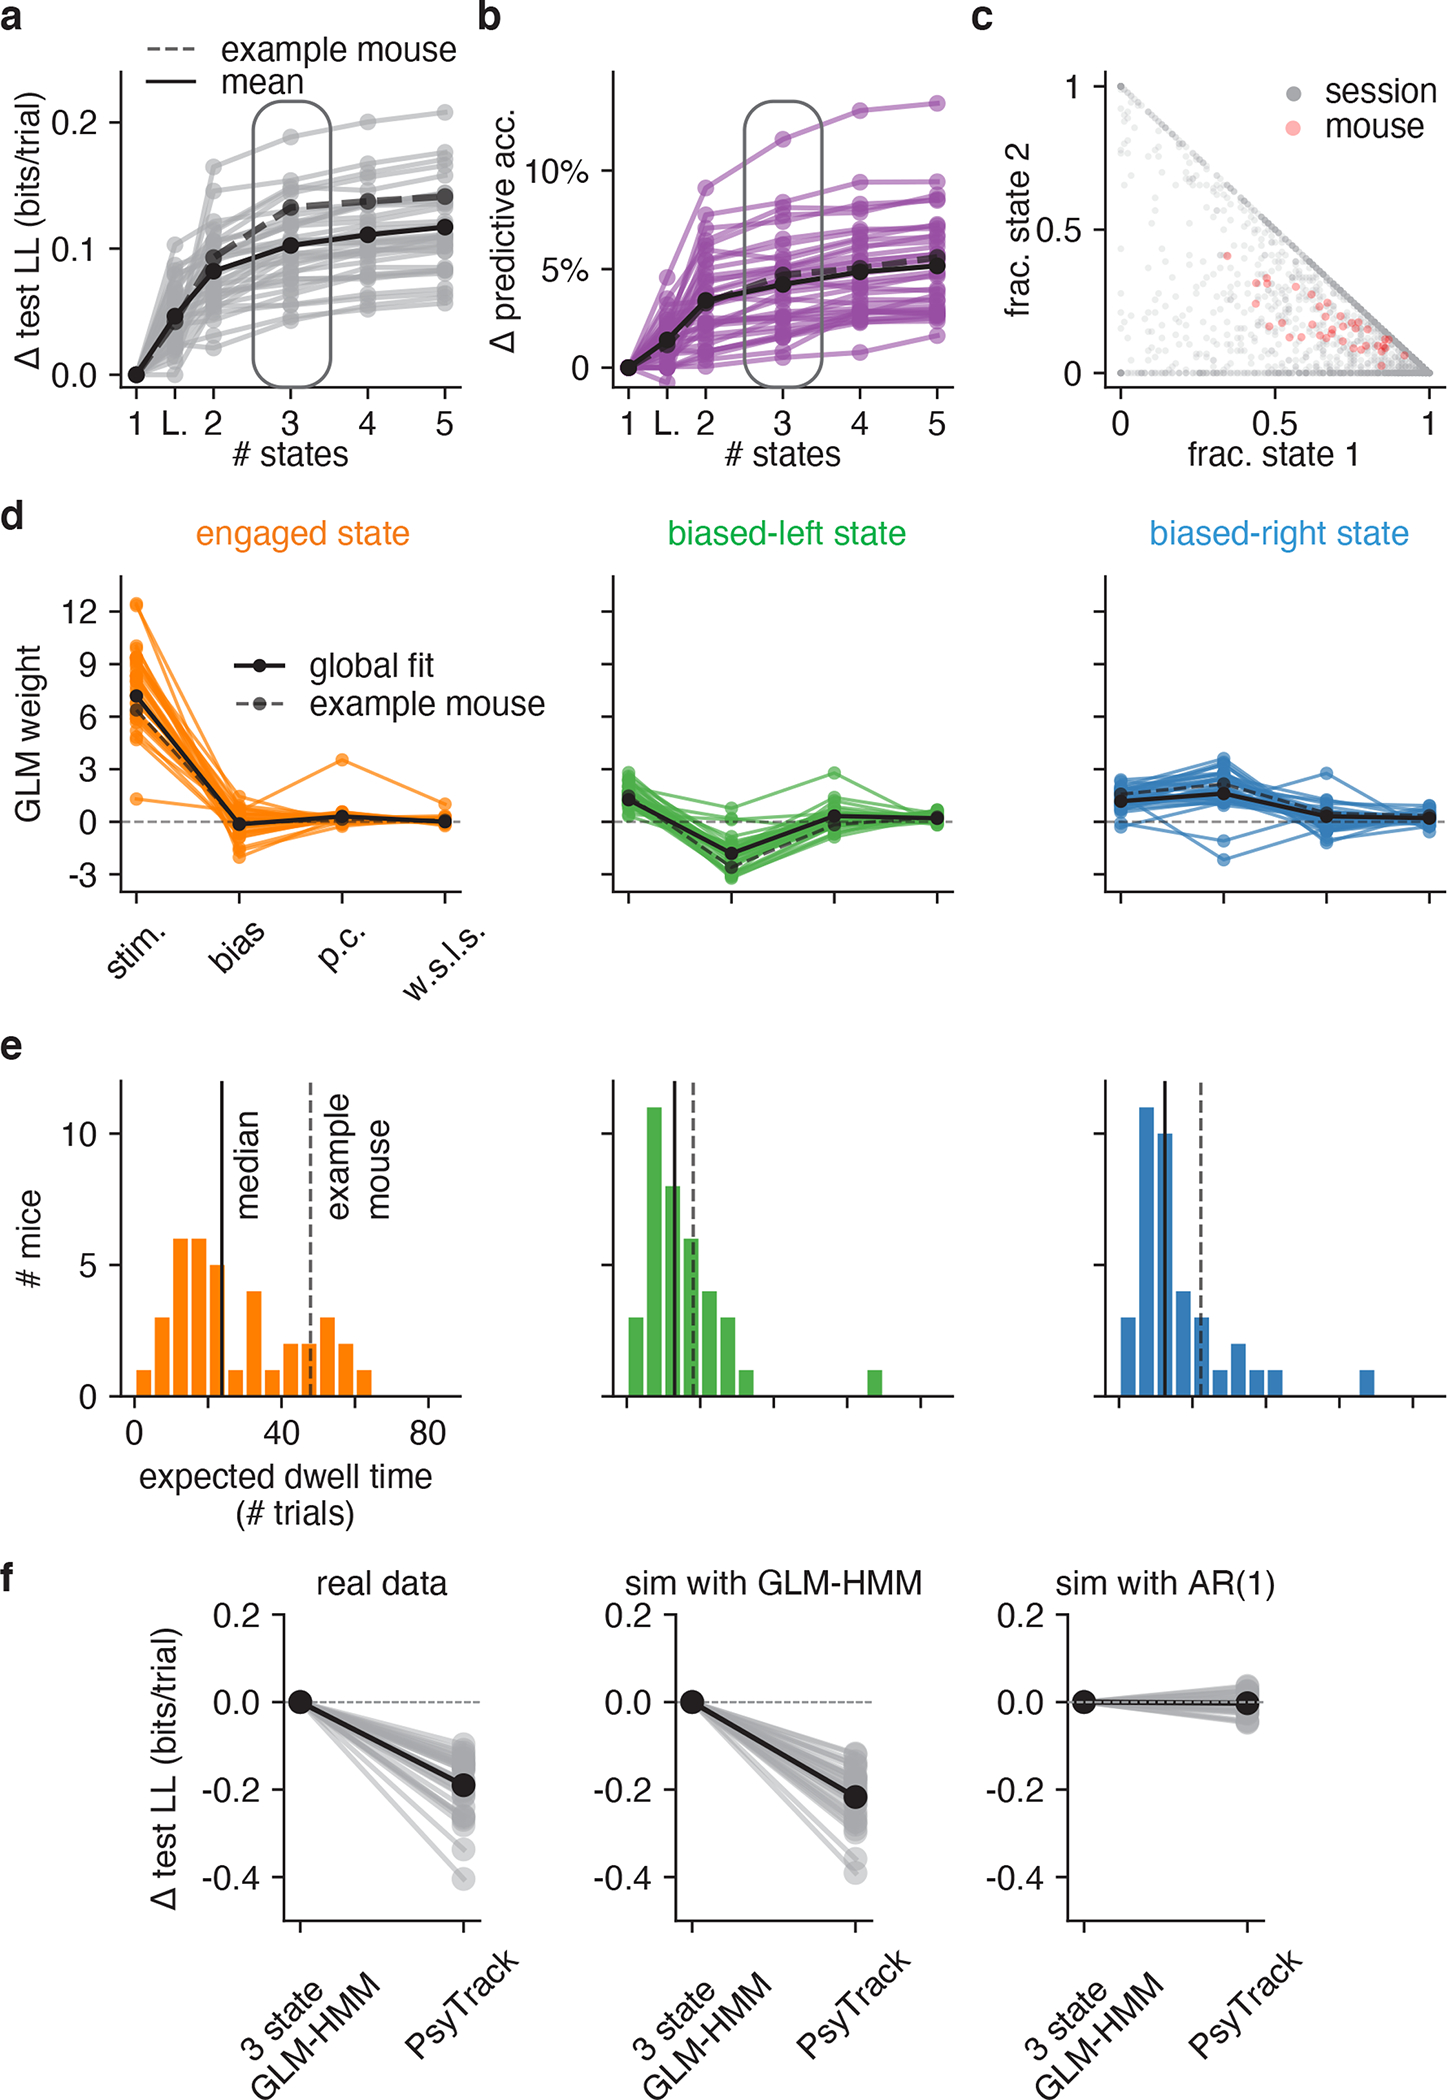
Figure 4: Model fits to full population of 37 IBL mice.

(a) Change in test log-likelihood as a function of number of states relative to a (1-state) GLM, for each mouse in the population. The classic lapse model, a restricted form of the 2-state model, is labeled ‘L’. Each trace represents a single mouse. Solid black indicates the mean across animals, and the dashed line indicates the example mouse from Figs. 2 and 3. The rounded rectangle highlights performance of the 3-state model, which we selected for further analyses. (b) Change in predictive accuracy relative to a basic GLM for each mouse, indicating the percentage improvement in predicting choice. (c) Grey dots correspond to 2017 individual sessions across all mice, indicating the fraction of trials spent in states 1 (engaged) and 2 (biased left). Points at the vertices (1, 0), (0, 1), or (0, 0) indicate sessions with no state changes, while points along the sides of the triangle indicate sessions that involved only 2 of the 3 states. Red dots correspond the same fractional occupancies for each of the 37 mice, revealing that the engaged state predominated, but that all mice spent time in all 3 states. (d) Inferred GLM weights for each mouse, for each of the three states in the 3-state model. The solid black curve represents a global fit using pooled data from all mice (see Algorithm 1); the dashed line is the example mouse from Fig. 2 and Fig. 3. (e) Histogram of expected dwell times across animals in each of the three states, calculated from the inferred transition matrix for each mouse. (f) Mice have discrete—not continuous—decision-making states. Left: Cross-validation performance of the 3 state GLM-HMM compared to PsyTrack [35, 36] for all 37 mice studied (each individual line is a separate mouse; black is the mean across animals). Middle: As a sanity check, we simulated datasets from a 3 state GLM-HMM with the parameters for each simulation chosen as the best fitting parameters for a single mouse. We then fit the simulated data both with PsyTrack and with the 3 state GLM-HMM in order to check that the 3 state GLM-HMM best described the data. Right: We did the opposite and fit PsyTrack to the animals’ data and then generated data according to an AR(1) model with parameters specified using the PsyTrack fits (see section 4.3 for full details). By performing cross-validation on the simulated data, we confirmed that we could use model comparison to distinguish between discrete and continuous decision-making behavior in choice data.
