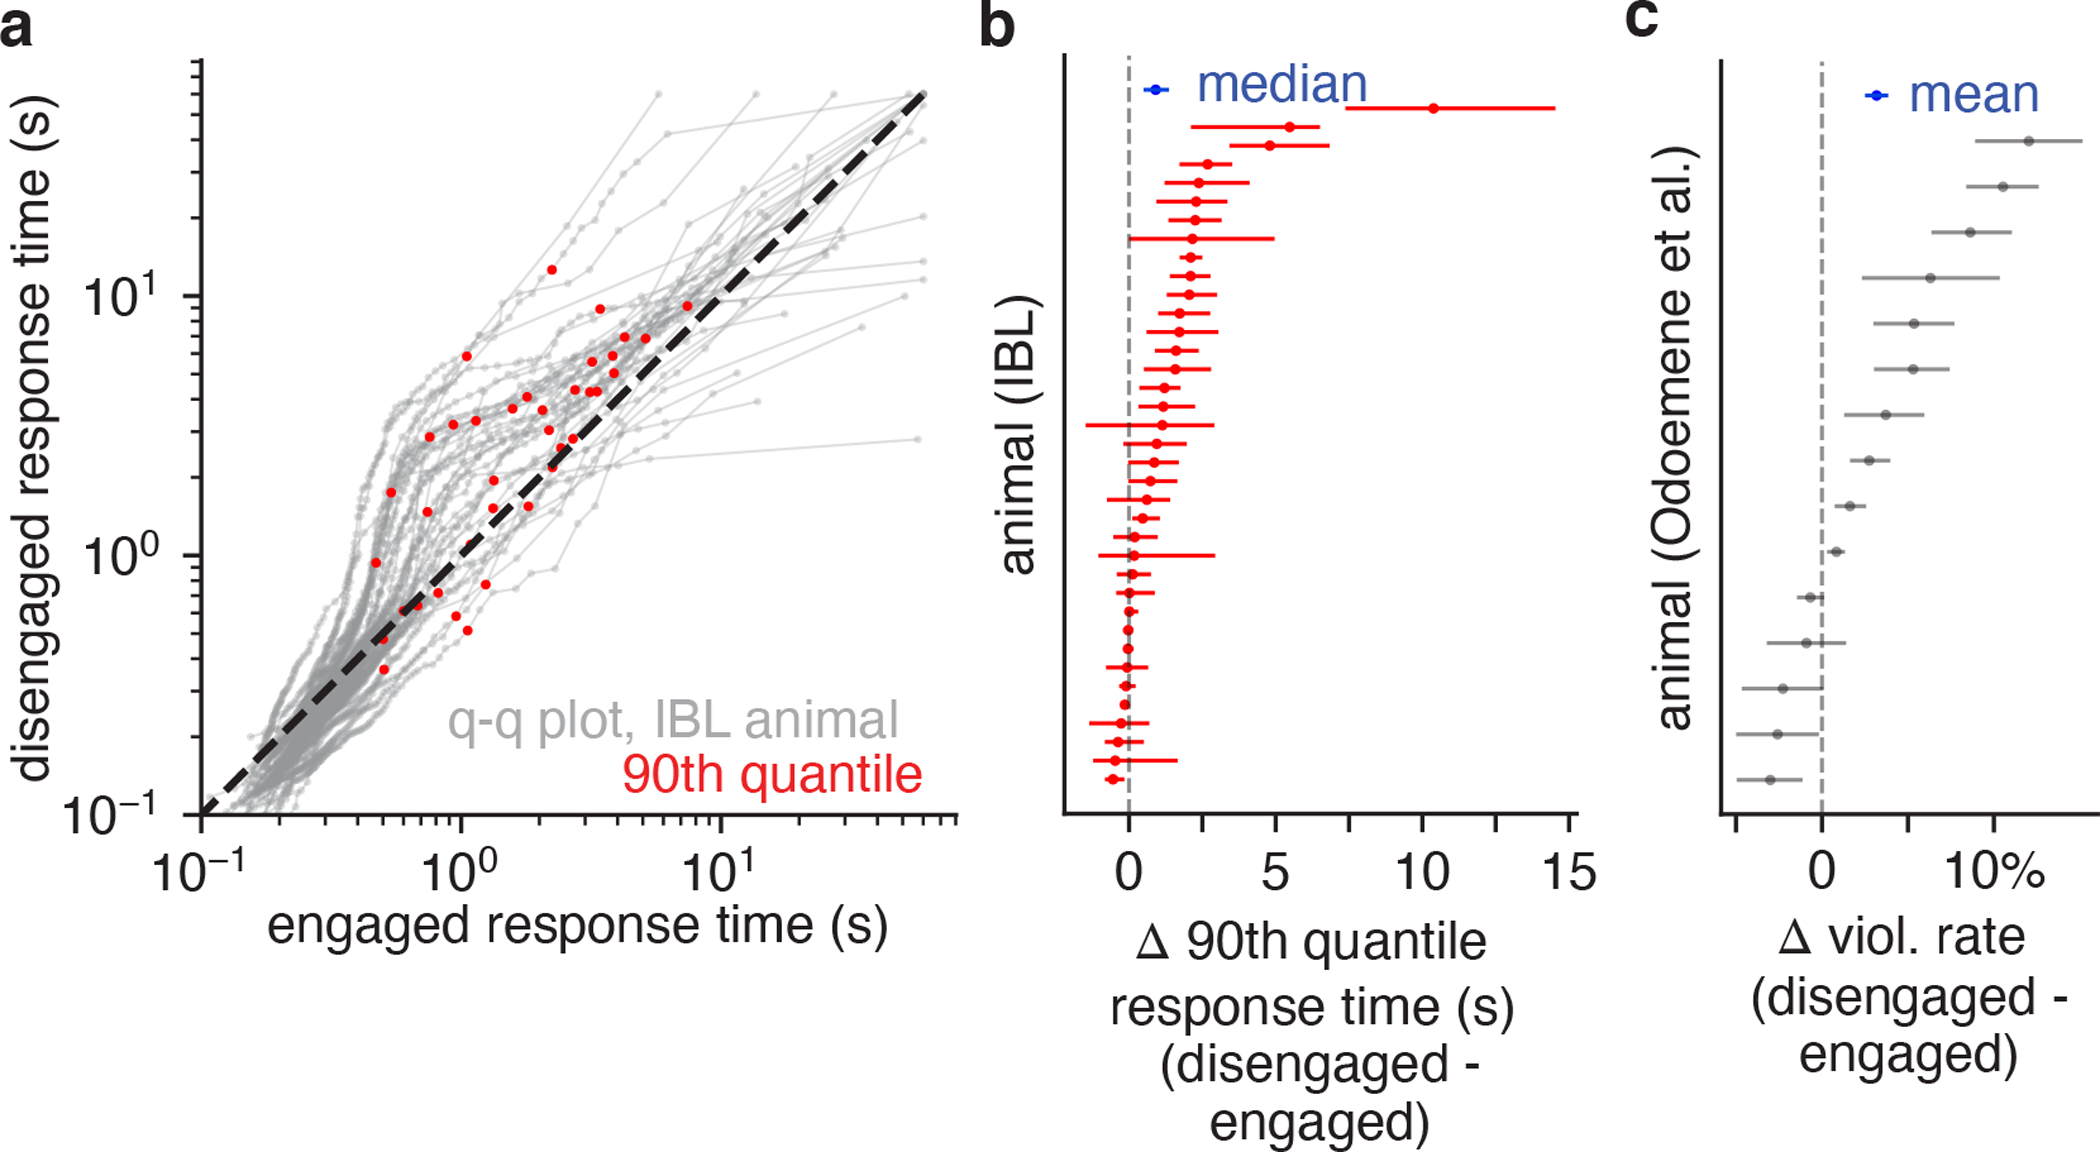
Figure 6: Behavioral correlates for GLM-HMM states.

(a) Q-Q plots for response time distributions associated with engaged and disengaged (biased left/rightward) states for IBL mice. Each curve is an individual animal, and the red dots indicate the 90th quantile response times. For all 37 mice, a KS-test indicated that the engaged and disengaged response time distributions were statistically different. Furthermore, as can readily be observed from the Q-Q plots, the longest response times typically occurred in the disengaged state. (b) Difference in the 90th quantile response time for the engaged and disengaged states for each IBL animal, as well as 95% bootstrap confidence intervals (n=2000). Blue is the median difference across mice (0.95s), as well as the 95% bootstrap confidence interval. (c) Violation rate differences for mice in the Odoemene et al. [20] dataset when in the engaged (state 1) and disengaged states (states 2, 3, 4). Error bars are 95% bootstrap confidence intervals (n=2000); blue indicates the mean difference in violation rate across all mice (3.2%).
