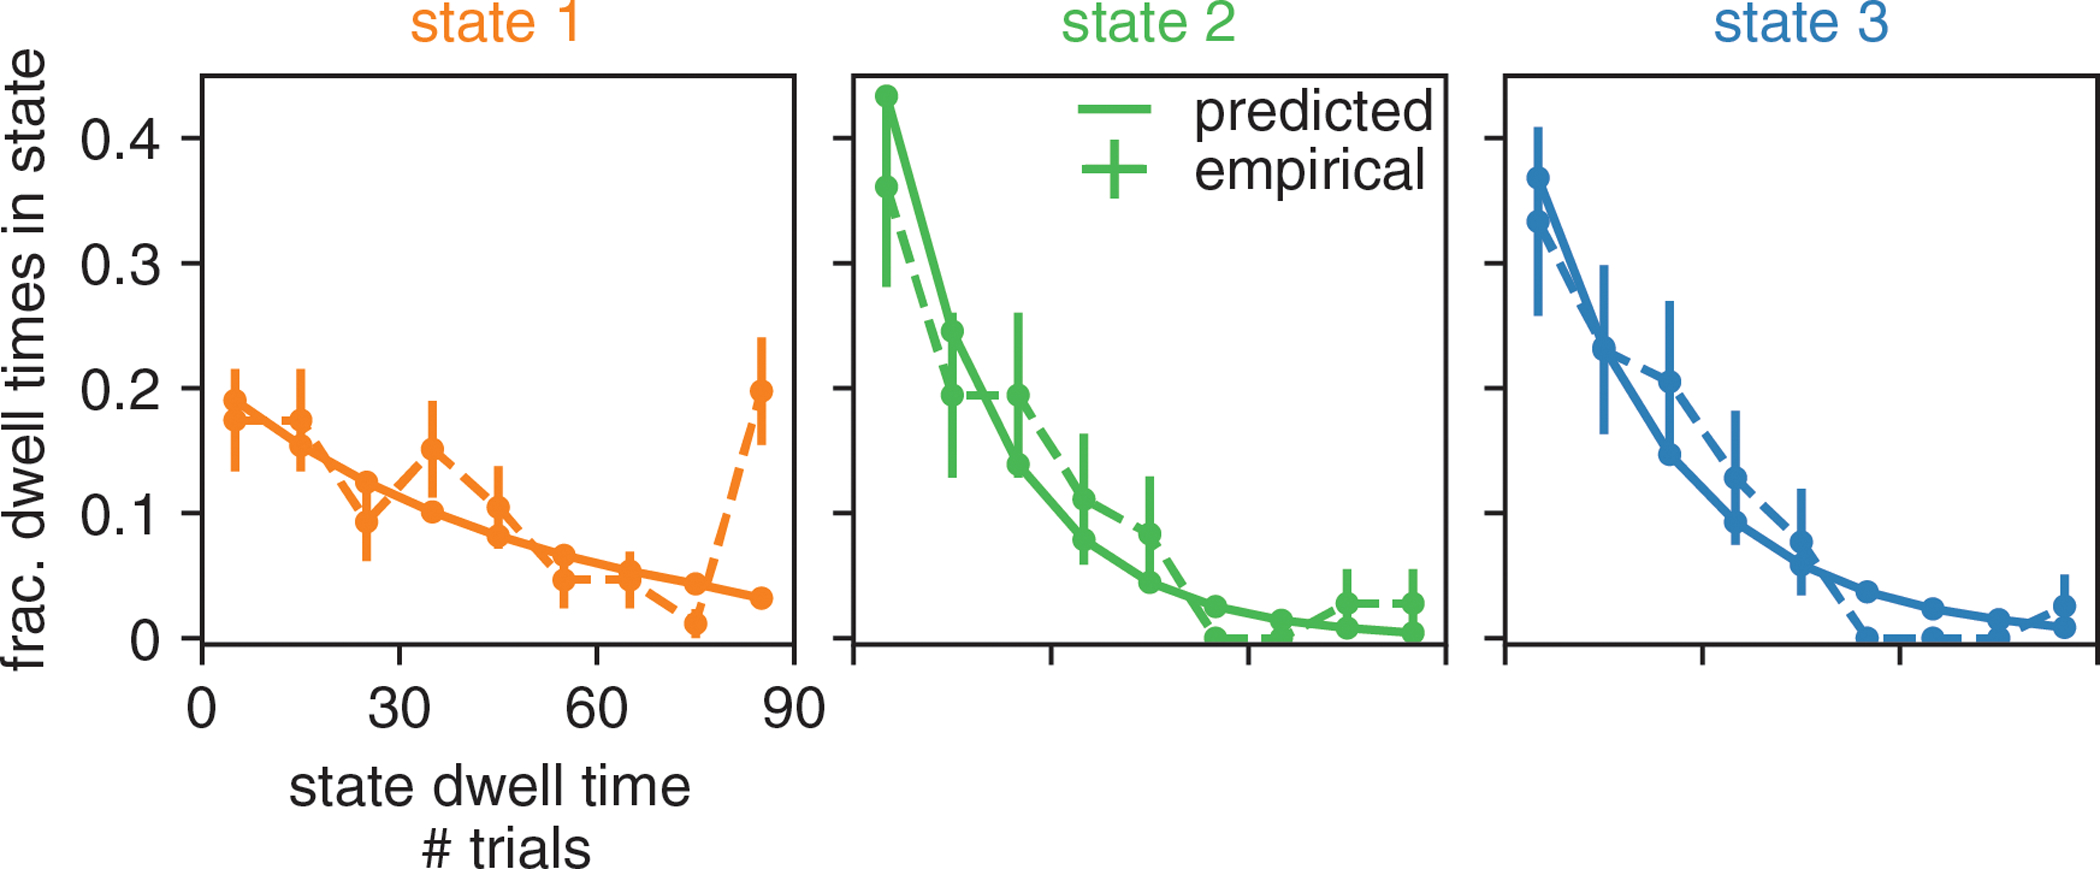
Figure ED2: Retrieved state dwell times are approximately geometrically distributed.

With the solid line, we show the predicted dwell times (according to the retrieved transition matrix) in each of the three states for the example animal of Fig. 2 and Fig. 3. Predicted dwell times can be obtained from the transition matrix as because state dwell times in the Hidden Markov Model are geometrically distributed. We then use the posterior state probabilities to assign states to trials in order to calculate the dwell times that are actually observed in the real data (shown with the dashed line); we also show the 68% confidence intervals associated with these empirical probabilities (n is between 36 and 86, depending on state). We find that the empirical dwell times for the biased leftward and rightward states seem to be geometrically distributed. For the engaged state, because there are some entire sessions (each session is 90 trials) during which the animal is engaged, we see that the empirical dwell times associated with this state are not as well described by a geometric distribution. A future direction may be to allow non-geometrically distributed state dwell times by replacing the Hidden Markov Model with e.g. the Hidden semi-Markov Model [0].
