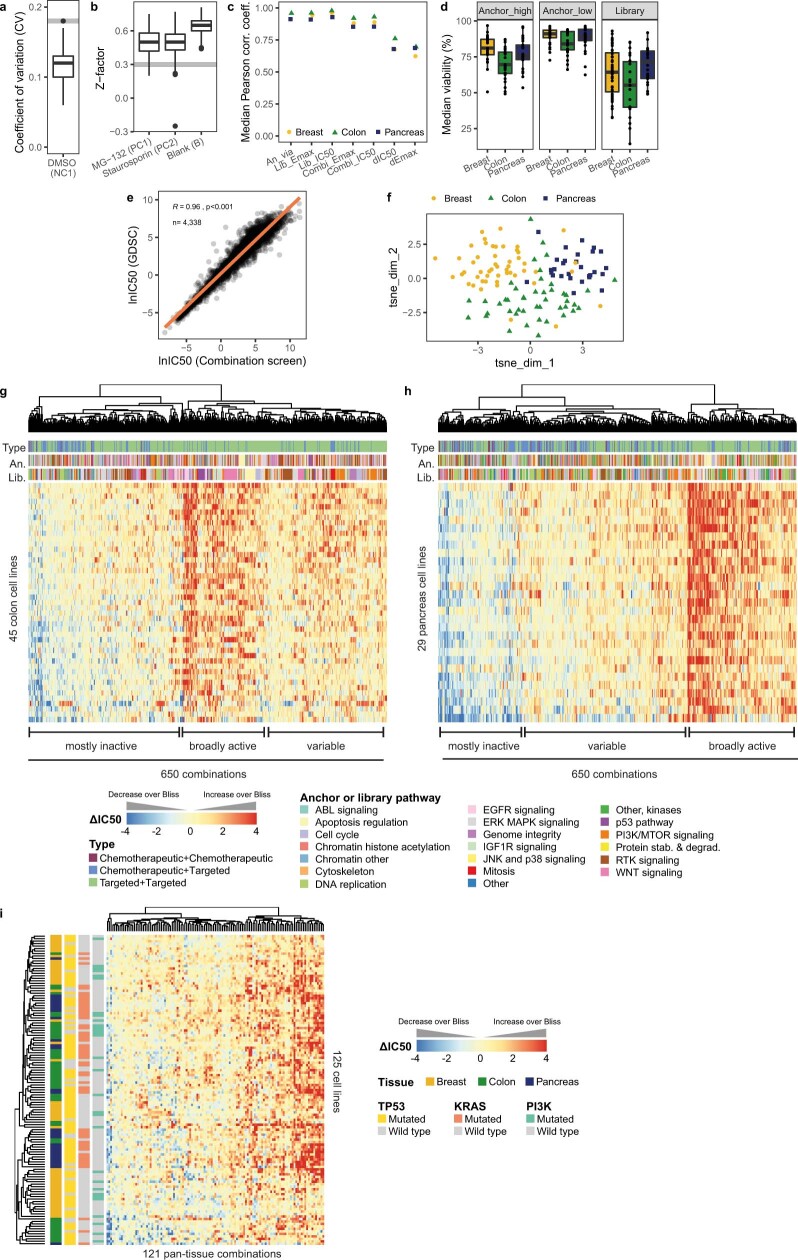
Extended Data Fig. 2. Screen quality control, single-agent response and combination response trends.
a, The coefficient of variation of the negative control DMSO across all 3,106 drug screening plates is low. Grey dashed line represents the quality control threshold of CV < 0.18. Median and interquartile range (IQR). b, The plate Z-factor scores for positive control drugs (MG-132, staurosporine) and blank wells across all drug screening plates. Grey dashed line represents the plate threshold of Z-factor > 0.3. Median and IQR. c, Single-agent and combination responses are well correlated across biological replicates (r > 0.6, p-value < 0.05) . Replicate data was collected over the duration of screening at various time points for 4-5 cell lines per tissue. Drug responses were averaged across technical replicates and correlated across biological replicates (n = 2–18, median = 4 biological replicates per ‘anchor concentration-library-cell line’ tuple) using Pearson correlation coefficient with Fisher’s Z transform as statistical test. d, Monotherapies captured an informative range of drug response at the concentration selected, generally having weak to moderate activity in cell lines. Median anchor (anchor viability by anchor concentration) and library (library Emax) responses across cell lines within a tissue. n = 26 drugs in colon and pancreas, n = 25 anchors and n = 52 libraries in breast. Median and IQR. e, Library IC50s were highly correlated with corresponding drug responses from the Genomics of Drug Sensitivity in Cancer, with IC50 on natural log scale. Pearson correlation coefficient, n = 4,338 drug-cell line pairs. f, Tissue accounts for some, but not all, variance in combination response. Dimensional reduction using t-SNE analysis on combination responses (ΔIC50) of 121 pan-tissue combinations across 125 cancer cell lines. g, h, Heatmaps of combination responses (ΔIC50) in 45 colon (g) or 29 pancreas (h) cell lines. Drug responses were clustered by combination and are annotated by combination type and anchor (An.) and library (Lib.) pathway. Rows are sorted by conditional mean ΔIC50 on cell line identity. n = 650 combinations. i, Heatmap of combination responses (ΔIC50) for 121 pan-tissue combinations across 125 breast, colon and pancreas cancer cell lines, clustered by combination and cell line. For all heatmaps ΔIC50 limits were clipped to −4 and 4.

