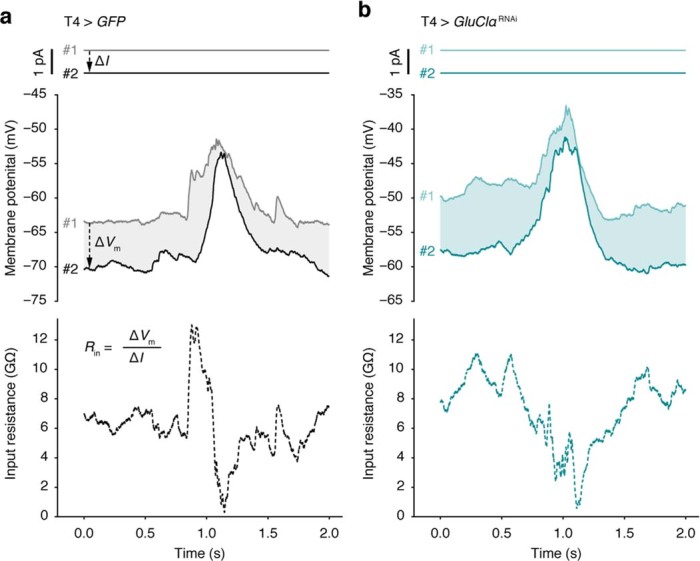
Extended Data Fig. 9. Input resistance measurements during visual stimulation.

Holding currents (solid lines, top), membrane potentials (solid lines, centre), and input resistances (dashed lines, bottom) of exemplary T4 neurons expressing either GFP (a) or GFP + GluClαRNAi (b). To obtain input resistance measurements at high temporal resolution, neurons were subjected to at least two repetitions of identical visual stimulation while recording their membrane potentials. In this case, the stimulus was an ON edge moving at 30° s−1 in the neuron’s preferred direction. The holding current I was altered in between the first (#1) and the second repetition (#2) by ΔI = −1 pA. The input resistance Rin at each time point was calculated as ΔVm/ΔI, where ΔVm denotes the difference in membrane potential between repetitions (shaded areas/dashed arrows in a).
