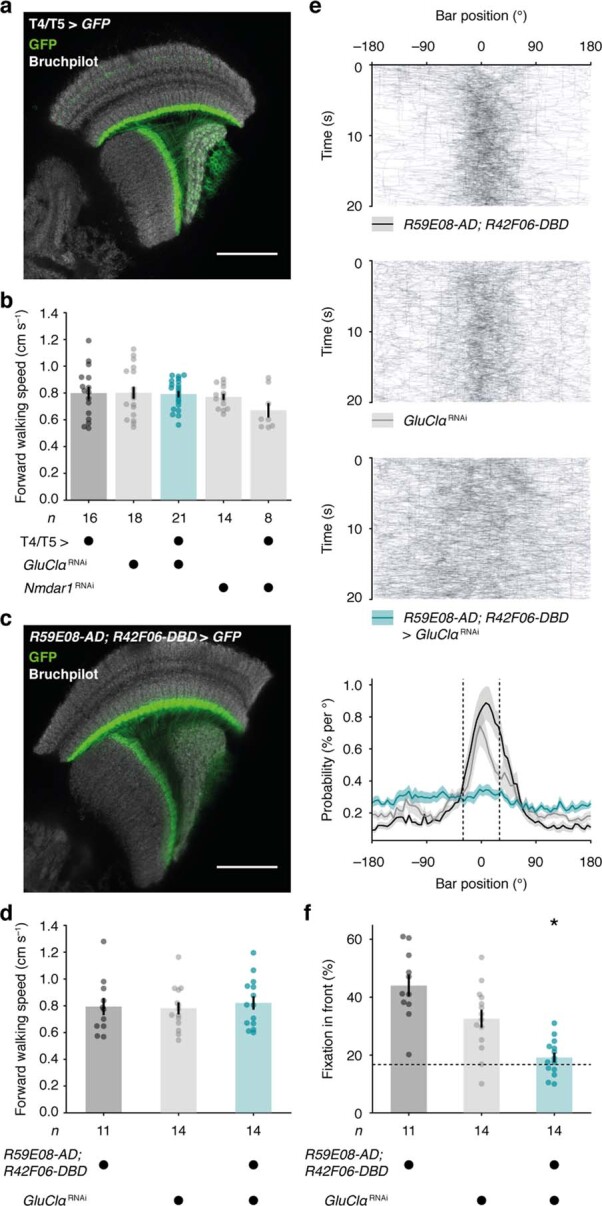
Extended Data Fig. 10. GAL4 expression patterns, walking speeds, and bar fixation.

a, Confocal cross section through the optic lobe of a fly expressing GFP (green) under control of R39H12-GAL4 (T4/T5 >) as used in behavioural experiments in Fig. 5d–i. Synaptic structures were counterstained with an antibody against bruchpilot (grey). Scale bar, 40 µm. The micrograph is representative of 8 biological replicates. b, Average forward walking speeds of flies expressing GluClαRNAi (teal) or Nmdar1RNAi (grey) in T4/T5 neurons and their parental controls (black/grey) during closed-loop bar fixation experiments in Fig. 5h, i. c, Confocal cross section through the optic lobe of a fly expressing GFP (green) under control of the split GAL4 line R59E08-AD; R42F06-DBD. Synaptic structures were counterstained with an antibody against bruchpilot (grey). Scale bar, 40 µm. The micrograph is representative of 5 biological replicates. d, Average forward walking speeds of flies expressing GluClαRNAi (teal) under control of R59E08-AD; R42F06-DBD and their parental controls (black/grey) during closed-loop bar fixation in e, f. e, Exemplary bar trajectories (242 trials and 11 flies per genotype, top) and the overall bar position probabilities (bottom) for flies expressing GluClαRNAi (teal) under control of R59E08-AD; R42F06-DBD and their parental controls (back/grey). Data are mean ± s.e.m. of flies in f. f, The percentage of time that the bar occupied a central 60° window (fixation in front, dashed lines in e). The dashed line indicates the chance level. Circles, individual flies; bars, mean ± s.e.m. Asterisk denotes a significant difference from both parental controls (P = 0.0012, one-way ANOVA followed by Holm–Šídák’s multiple comparisons test). n values indicate the number of flies.
