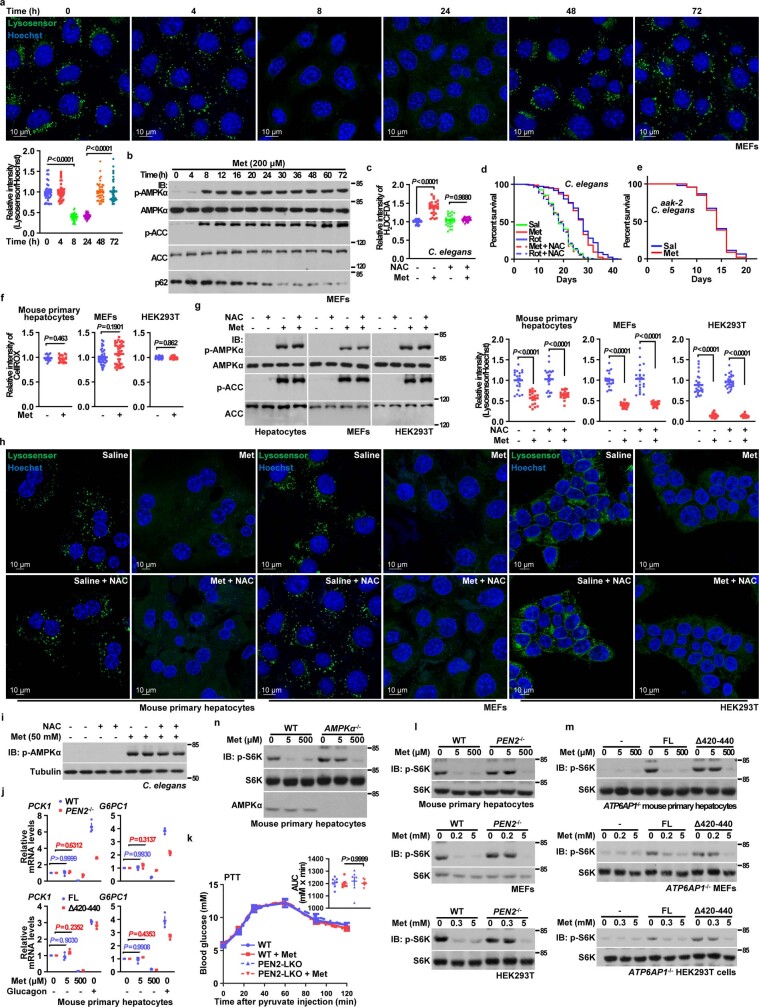
Extended Data Fig. 14. Autophagy and ROS elevation are downstream events of AMPK, and are not involved in metformin-induced AMPK activation.
a, b, Autophagy occurs in MEFs treated with metformin. MEFs were treated with 200 μM metformin for indicated durations. Protein levels of the autophagy reporter p62 and the phosphorylation levels of AMPK and ACC (b), as well as the lysosomal pH (a), were determined by immunoblotting using the indicated antibodies (b) or by visualisation with Lysosensor dye (a). Results of a (relative intensities of Lysosensor, processed as in Fig. 1a) are shown as mean ± s.e.m., n = 40 cells from 4 dishes/experiment for 0 h, and n = 40 cells for 4 h, 24 h and 48 h, n = 41 cells for 8 h, and n = 42 cells for 72 h, all from 6 dishes/experiments; and P value by one-way ANOVA, followed by Dunn. c, f, Metformin elevates ROS levels in C. elegans, but not in MEFs, HEK293T cells and mouse primary hepatocytes. In c, L4 larvae of N2 were cultured on NGM plates containing 50 mM metformin, 5 mM NAC for one day, and were then stained with 10 μM CM-H2DCFDA followed by determination of ROS by imaging. Data are shown as mean ± s.e.m., n = 30 worms for control (untreated) condition or n = 25 worms for other conditions; and P value by two-way ANOVA, followed by Tukey (c). In f, MEFs and HEK293T cells were treated with 200 or 300 μM metformin for 12 h, and mouse primary hepatocytes were treated with 5 μM metformin for 2 h. Cells were stained with 5 μM CellROX Deep Red, followed by determination of ROS by imaging. Data are shown as mean ± s.e.m., n = 20 (for hepatocytes and HEK293T cells) or 40 (for MEFs) cells from 4 dishes/experiment; and P value by two-sided Student’s t-test (hepatocytes) or two-sided Mann-Whitney test (MEFs and HEK293T cells). d, e, ROS and AMPK are both required for the metformin-mediated lifespan extension of C. elegans. L4 larvae of N2 or AMPK-deficient (aak-2) strain were cultured on NGM plates containing 50 mM metformin, 5 mM NAC (in d, for inhibiting ROS), or 0.1 μM rotenone (in d, as a positive control for ROS induction). Lifespans were determined, and results are shown as Kaplan-Meier curves, see also statistical analysis data on Supplementary Table 3. g, i, NAC does not affect metformin-induced AMPK activation. Mouse primary hepatocytes, MEFs, HEK293T cells (g), or nematodes (i) were pre-treated with 5 mM NAC for 24 h, followed by treating with 5 μM metformin for 2 h, 200 μM metformin for 12 h, 300 μM metformin for 12 h, or 50 mM metformin for 2 days. Levels of p-AMPKα and p-ACC were then determined by immunoblotting. h, NAC does not affect metformin-induced v-ATPase inhibition. Primary hepatocytes, MEFs, or HEK293T cells were treated as in g, followed by analysis of lysosomal pH with the Lysosensor dye. Data (relative intensity of Lysosensor, processed as in Fig. 1a) were graphed as mean ± s.e.m., n = 20 cells from 3 dishes/experiment (for hepatocytes), n = 20 cells from 3 dishes/experiment (for MEFs), or n = 24 cells for normal condition and normal condition with NAC, and n = 25 for metformin treatment and metformin plus NAC treatment, all from 4 dishes/experiment (for HEK293T cells). P value within each treatment was determined by two-way ANOVA, followed by Tukey. j, Low metformin does not alter the expression of gluconeogenic genes. Mouse primary hepatocytes isolated from PEN2-LKO mice or its wildtype littermates, or ATP6AP1-LKO mice re-introduced full length ATP6AP1 or ATP6AP1Δ420-440 mutant were treated with 5 μM metformin, 500 μM metformin (high dose, as a control), or 100 nM of glucagon (as a positive control for elevation of the expression of gluconeogenic genes) for 2 h, followed by analysis of mRNA levels of PCK1 and G6PC1 by real-time PCR. Data are shown as mean ± s.e.m.; n = 3 for each genotype/treatment, and P value by two-way ANOVA, followed by Tukey. k, Hepatic PEN2 is not required for the inhibition of gluconeogenesis by metformin. Mice at 5 weeks old with hepatic PEN2 knocked out, along with its wildtype littermates, were treated with metformin in drinking water (1 g/l) for another 7 days (tamoxifen was injected at 4 weeks old). At the day 8, mice were starved for 16 h, followed by pyruvate tolerance test. Results are shown as mean ± s.e.m., n = 7 for each genotype/treatment, and P value by two-way RM ANOVA followed by Tukey; see also inset for AUC values, P value by two-way ANOVA followed by Tukey. l, m, The PEN2-ATP6AP1 axis is required for the inhibition of mTORC1 by low metformin. MEFs, HEK293T cells and mouse primary hepatocytes with PEN2 knockout (l), ATP6AP1 knockout and with re-introduced full length ATP6AP1 or ATP6AP1Δ420-440 (m), were treated with 200 μM and 5 mM metformin (for MEFs), 300 μM and 5 mM metformin (for HEK293T cells) for 12 h, 5 μM and 500 μM metformin (for mouse primary hepatocytes). Cells were then lysed, and the activity of mTORC1 was determined by immunoblotting the phosphorylation levels of its substrate S6K (p-S6K). n, AMPK is required for the inhibition of mTORC1 by low metformin. AMPKα1/2-/- mouse primary hepatocytes were treated with 5 μM and 500 μM metformin for 2 h. Cells were then lysed, and the activity of mTORC1 was determined by immunoblotting the phosphorylation levels of its substrate S6K (p-S6K). Experiments in this figure were performed three times, except a, j, l, m four times.

