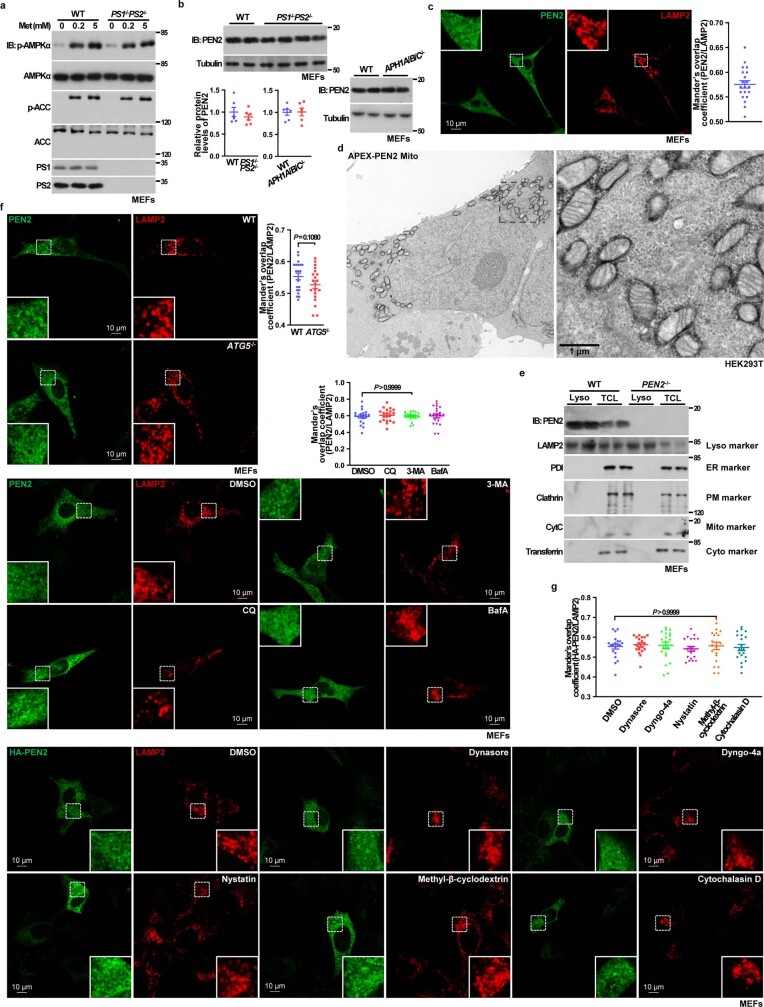
Extended Data Fig. 4. Other subunits of γ-secretase are not required for AMPK activation by low metformin.
a, Loss of presenilins does not affect metformin-induced activation of AMPK. MEFs with PS1 and PS2 double knocked out were treated with 200 μM or 5 mM metformin for 12 h, followed by analysis of p-AMPKα and p-ACC. b, Protein levels of PEN2 in MEFs with knockout of presenilins (left panel) or APH1 (right panel). Cells were lysed for analysis of PEN2 protein levels by immunoblotting, followed by densitometry analysis. Statistical analysis results were shown as mean ± s.e.m.; n = 6. c, A portion of PEN2 is localised on the surface of lysosome. MEFs were stained with rabbit anti-PEN2 antibody and rat anti-LAMP2 antibody, followed by staining with Alexa Fluor 488 goat anti-rabbit IgG and Alexa Fluor 594 donkey anti-rat IgG secondary antibodies. The areas defined by dashed boxes on each representative image are enlarged as insets. Mander’s overlap coefficients are plotted as mean ± s.e.m., n = 20. d, As a control for Fig. 2e, APEX-tagged TOMM20-PEN2 chimeric construct shows mitochondrial localisation. HEK293T cells stably expressing APEX-tagged TOMM20-PEN2 fused protein (APEX-PEN2 Mito, expressed at close-to-endogenous levels) were imaged under a transmission electron microscope. e, Subcellular fractionation assays show that the lysosomal fraction contains PEN2. The lysosome fractions (purified as described in Methods section), along with total cell lysates of MEFs, or PEN2-/- MEFs as a control, were subjected to immunoblotting using the indicated antibodies (Lyso, lysosome; ER, endoplasmic reticulum; PM, plasma membrane; Mito, mitochondrion; Cyto, cytosol). f, The PEN2 lysosomal localisation is not altered when autophagy is blocked. The lysosomal localisation of PEN2 was determined by staining PEN2 and LAMP2 in WT MEFs and ATG5-/- MEFs, or WT MEFs treated with 20 μM chloroquine (CQ), 4 mM 3-MA, or 0.5 μΜ bafilomycin A (bafA) for 12 h. Mander’s overlap coefficients are plotted as mean ± s.e.m., n = 20 for each genotype/treatment, with P values calculated by one-way ANOVA, followed by Dunn (for autophagy inhibitors) or by two-sided Student’s t-test (for ATG5-/- MEFs). g, Inhibition of endocytosis does not alter the lysosomal PEN2 localisation. MEFs were treated with 60 μM Dynasore for 0.5 h, 10 μM Dyngo-4a for 30 h, 20 μM Nystatin for 1 h, 2 mM methyl-β-cyclodextrin for 6 h, or 1 μM cytochalasin D for 0.5 h. Co-localisation of HA-tagged PEN2 and LAMP2 was then determined by immunofluorescent staining, and the Mander’s overlap coefficients are plotted as mean ± s.e.m., n = 20 for each genotype/treatment, with P values calculated by one-way ANOVA, followed by Dunnett. Experiments in this figure were performed three times.

