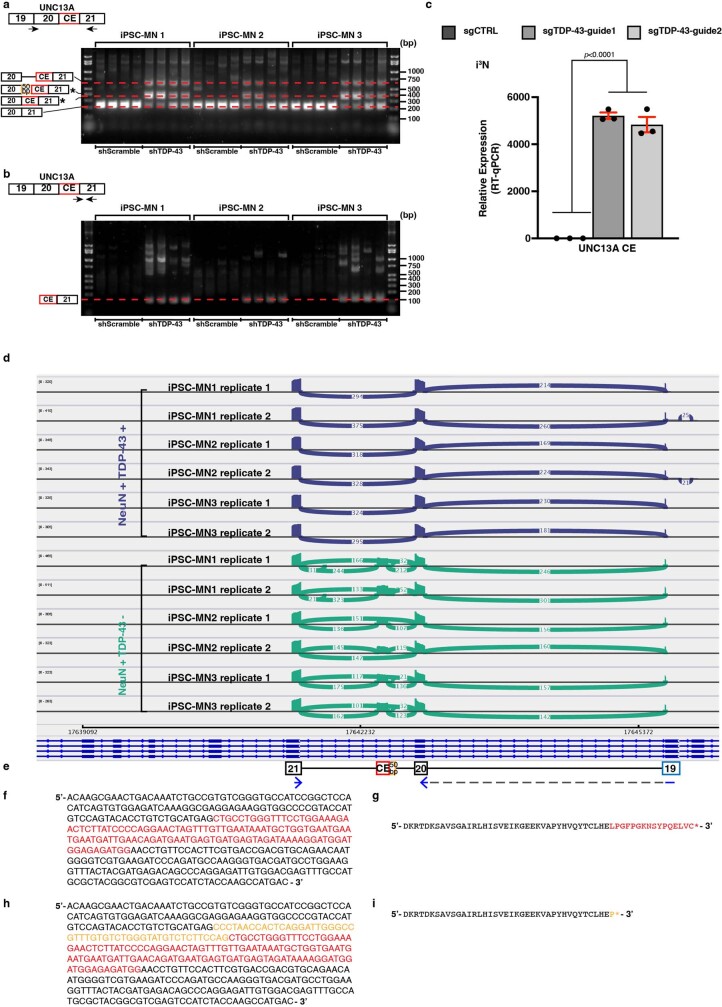
Extended Data Fig. 3. Depletion of TDP-43 from iPSC derived motor neurons (iPSC-MNs) and iPSC derived neurons (i3Ns) leads to cryptic exon inclusion in UNC13A.
(a) RT-PCR confirmed the expression of the cryptic exon-containing UNC13A splice variant upon TDP-43 depletion in three independent iPSC-MNs (n = 4 independent cell culture experiments for each condition). Gel picture shows results from all 4 experiments performed. In addition to the splice variant containing the 128 bp and 178 bp cryptic exons, we also detected inclusion of the complete intron upstream of the cryptic exon (Fig. 4e, Supplementary Note 2). The 128 bp and 178 bp cryptic exons cannot be distinguished here but they are detected through amplicon sequencing the corresponding band (d). The PCR products represented by each band are marked to the left of each gel. The location of the PCR primer pair used is shown on top of each gel image. (b) The PCR primer pairs spanning the cryptic exon and exon 21 junction confirms cryptic exon inclusion only occurs upon TDP-43 knockdown. For gel source data, see Supplementary Fig. 1c, d. (c) RT-qPCR analyses confirmed the inclusion of UNC13A cryptic exon upon TDP-43 depletion in iPSC derived neurons (i3Ns). TDP-43 was depleted by expressing two different sgRNAs: sgTDP-43-guide1 and sgTDP-43-guide2 in i3Ns stably expressing CRISPR inactivation machinery (CRISPRi). RPLP0 and GAPDH were used to normalize RT-qPCR. (n = 3 independent cell culture experiments for each condition; Ordinary one-way ANOVA with Dunnett’s multiple comparisons test, mean ± s.e.m.). (d) Sashimi plot visualization of the alignment (hg38) of the amplicon (2 × 250 bp) sequencing reads of the sequences amplified using primers (blue) shown in (e). Both the 128 bp and the 178 bp cryptic exons were supported by the sequencing reads. (e) Schematic of the exons amplified by the primers (blue). (f, h) DNA sequence of the 128 bp and 178 bp cryptic exons and their flanking exons. The sequences are color coded according to (e). (g, i) The amino acid sequences correspond to the DNA sequences in (f, h). The asterisks indicate stop codons are encountered.

