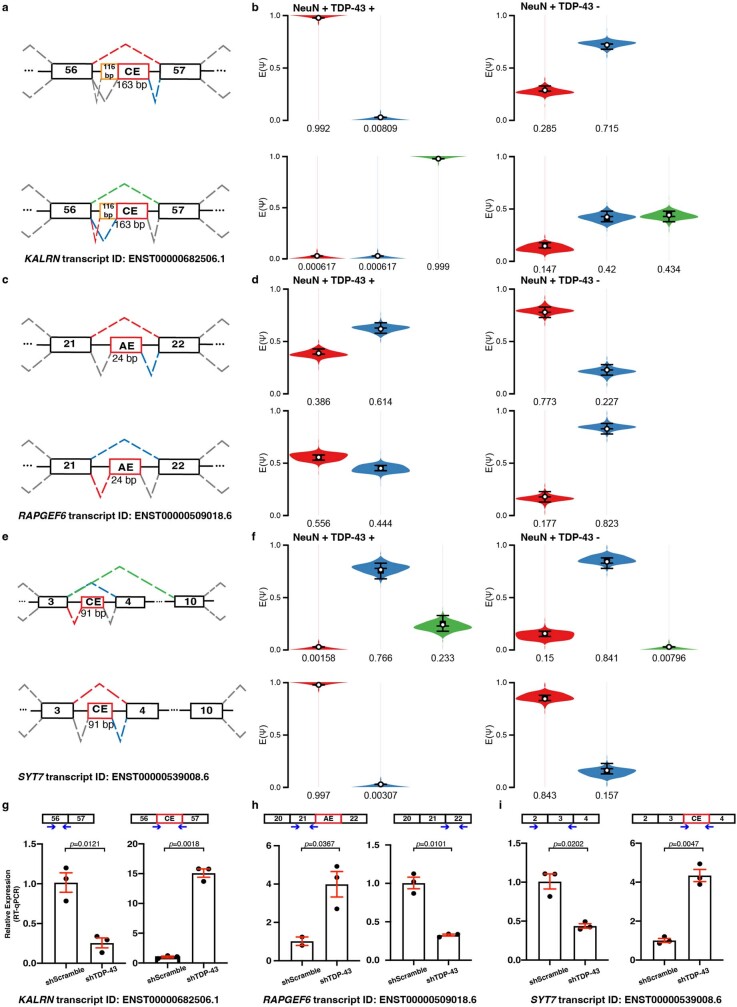
Extended Data Fig. 4. Validation of additional splicing targets.
(a–f) Depletion of TDP-43 introduces cryptic exons into KALRN mRNA and SYT7 mRNA; In RAPGEF6, TDP-43 depletion leads to a decrease in the usage of the exon AE (for alternative exon) between exon 21 and exon 22 of the isoform ENST0000509018.6. Exon AE does exist in some other isoforms of RAPGEF6, indicating the depletion of TDP-43 could lead to changes in isoform composition. (b, d, f) Violin plots corresponding to (a, c, e), respectively. Each violin in (b, d, f) represents the posterior probability distribution of the expected relative inclusion (PSI or Ψ) for the color matching junction in the splice graph. The tails of each violin represent the 10th and 90th percentile. The box represents the interquartile range with the line in the middle indicating the median. The white circles mark the expected PSI (E[Ψ]). The change in the relative inclusion level of each junction between two conditions is referred to as ΔΨ or ΔPSI13. (g–i) RT-qPCR analyses confirmed changes in exon usage upon TDP-43 depletion in iPSC-derived neurons. RPLP0 and GAPDH were used to normalize RT-PCR. (n = 3 independent cell culture experiments for each condition, two sided-Welch Two Sample t-test, mean ± s.e.m.).

